
1811 E. Northrop Blvd.
Chandler, Arizona 85286
NOTICE OF 20202022 ANNUAL MEETING OF STOCKHOLDERS
To the Stockholders of Zovio Inc:
Notice is hereby given that the 20202022 Annual Meeting of Stockholders (the “Annual Meeting”) of Zovio Inc, a Delaware corporation, will be held on Wednesday, May 13, 2020June 15, 2022 at 9:00 a.m., Pacific Time, for the following purposes:
1. To elect three Class I directors, Ron Huberman, John J. Kiely and George P. Pernsteiner, for a three-year term to expire at the 2025 Annual Meeting of Stockholders;
2. To ratify the appointment of Deloitte & Touche LLP as our independent registered public accounting firm for the year ending December 31, 2022; and
3. To transact such other business as may be properly brought before the Annual Meeting or any adjournment thereof.
The Annual Meeting will be a completely virtual meeting of stockholders. To participate, vote or submit questions during the Annual Meeting via live webcast, please visit www.virtualshareholdermeeting.com/ZVO2020.ZVO2022. You will not be able to attend the Annual Meeting in person.
Whether or not you expect to attend the Annual Meeting via live webcast, please vote at your earliest convenience. You may vote over the internet, by telephone or, if you request to receive printed proxy materials, by mailing a proxy or voting instruction card. You may also vote your shares during the Annual Meeting. Submitting your proxy in advance of the Annual Meeting will not prevent you from voting your shares during the Annual Meeting, as your proxy is revocable at your option as described in the proxy statement accompanying this notice. Please review the instructions regarding each of your voting options described in the proxy statement as well as inand the Notice of Internet Availability of Proxy Materials or proxy card you received by mail.
| By Order of the Board of Directors, | ||
| /s/ | ||
Chandler, Arizona
May 20, 2022
ZOVIO INC
Table of Contents
1811 E. Northrop Blvd.
Chandler, Arizona 85286
General Information
The Board of Directors (the “Board”) of Zovio Inc, a Delaware corporation (“Zovio,” “the company,” “we,” “us” or “our”), has made these proxy materials available to you on the internet or, upon your request, has deliveredmailed these proxy materials to you in connection with the solicitation of proxies for use at the 20202022 Annual Meeting of Stockholders (the “Annual Meeting”). The Annual Meeting will be held live via internet webcast on Wednesday, May 13, 2020June 15, 2022 at 9:00 a.m., Pacific Time, or at any adjournment or postponement thereof, for the purposes stated herein. These proxy materials were first sent or givenmailed on April 2, 2020May 20, 2022 to all stockholders as of the record date.
Under rules adopted by the Securities and Exchange Commission (the “SEC”), we may furnishhave mailed the full set of our proxy materials, including this proxy statement, the proxy card and our Annual Report on Form 10-K for the year ended December 31, 20192021 filed with the SEC on February 20, 2020,April 15, 2022, to our stockholders by providing access to such documents on the internet instead of mailing printed copies. Most of you will not receive printed copiesrecord as of the proxy materials unless you request them. Instead, the Noticeclose of Internet Availability of Proxy Materials (the “Notice”), which was mailed to most of you, will instruct you as to how you may access and review all of the proxy materialsbusiness on the internet. The Notice also instructs you as to how you may submit your proxyApril 22, 2022, on the internet. If you would like to receive printed copies of our proxy materials by mail, please follow the instructions in the Notice for requesting such materials. If you request printed copies of the proxy materials by mail, the materials you receive will include the proxy card or voting instruction form for the Annual Meeting.around May 20, 2022. The proxy materials are also available to view and download at http://materials.proxyvote.com/98979V. We also encourage you to review our 2019 Annual Report available on our website at http://zvoannualreport2019.com/.
Participating in the Annual Meeting
We will host the Annual Meeting live via internet webcast. You will not be able to attend the Annual Meeting in person. A summary of the information you need in order to attend the Annual Meeting online is provided below:
•Any stockholder may listen to the Annual Meeting and participate live via the internet at www.virtualshareholdermeeting.com/ZVO2020ZVO2022. The live internet webcast will begin on May 13, 2020June 15, 2022 at 9:00 a.m., Pacific Time.
•Stockholders may vote and submit questions during the Annual Meeting live via the internet.
•To enter the meeting, please have your 16-digit control number, which is available on the Notice or, if you received a printed copy of the proxy materials, your proxy card.card or voting instruction form. If you do not have your 16-digit control number, you will be able to listen to the meeting only. You will not be able to vote or submit questions during the meeting.
•Instructions regarding how to connect and participate live via the internet including how to demonstrate proof of stock ownership, are posted at www.virtualshareholdermeeting.com/ZVO2020ZVO2022.
Voting Rights and Outstanding Shares
Only stockholders that owned our common stock at the close of business on March 26, 2020,April 22, 2022, the record date for the Annual Meeting, are entitled to notice of, and to vote at, the Annual Meeting. On the record date, 30,332,45034,075,329 shares of our common stock were outstanding. Each share of our common stock that you own entitles you to one vote on each matter to be voted upon at the Annual Meeting. We will have a quorum to conduct the business of the Annual Meeting if the holders of a majority of the outstanding shares of our common stock entitled to vote are present, in person or by proxy. Abstentions and
broker non-votes (i.e., shares of common stock held by a broker, bank or other agent that are represented at the meeting, but which the broker, bank or other agent is not empowered to vote on a particular proposal) will be counted for purposes of determining whether a quorum is present at the Annual Meeting.
Proposals for the Annual Meeting
The proposals scheduled to be voted on at the Annual Meeting are as follows:
•Elect three Class III directors, MichaelRon Huberman, John J. Kiely and George P. Cole, Ryan D. Craig and Michael B. Horn,Pernsteiner, for a three-year term to expire at the 20232025 Annual Meeting of Stockholders.
1
•Ratify the appointment of Deloitte & Touche LLP as our independent registered public accounting firm for the year ending December 31, 2020.
Voting Requirements to Approve Each Proposal
Proposal 1 - Election of Class III Directors. Directors are elected by a plurality vote of the shares present in person or represented by proxy and entitled to vote at a meeting at which a quorum is present. If a quorum is present, the three nominees for Class III director receiving the highest number of votes will be elected as Class III directors. Abstentions and broker non-votes will have no effect on the outcome of the vote. There is no cumulative voting for the election of Class III directors.
Proposal 2 - Ratification of the Appointment of Deloitte & Touche LLP. The proposal to ratify the appointment of Deloitte & Touche LLP as our independent registered public accounting firm for the fiscal year ending December 31, 20202022 may be approved by the affirmative vote of a majority of the shares present in person or by proxy and entitled to vote at a meeting at which a quorum is present. Abstentions have the same effect as votes “AGAINST” the proposal. This proposal is considered a routine or “discretionary” matter on which your broker, bank or other agent will be able to vote on your behalf even if it does not receive instructions from you; therefore, no broker non-votes are expected to exist in connection with this proposal.
Voting Shares Registered in Your Name
If you are a stockholder of record, that is, you have a Zovio stock certificate or hold Zovio shares in an account with our transfer agent, EQ Shareowner Services, you may vote in one of four ways:
•Vote via the internet following the instructions included with your Notice or proxy card;
•Vote by telephone following the instructions included with your proxy card;
•Complete, sign, date and return your proxy card by mail; or
•Vote during the Annual Meeting live via the internet by following the instructions posted at www.virtualshareholdermeeting.com/ZVO2020ZVO2022.
Votes submitted via the internet or by telephone must be received by 11:59 p.m., Eastern Time, on May 12, 2020.June 14, 2022. Proxy cards submitted by mail must be received no later than May 12, 2020June 14, 2022 to be voted at the Annual Meeting. Submitting your proxy via the internet, by telephone or by mail will not affect your right to vote during the Annual Meeting live via the internet. For additional information, please see “Revocability of Proxies” below.
Voting Shares Registered in the Name of a Broker, Bank or Other Agent
Most beneficial owners holding stock in “street name” will receive instructions for voting their shares from their broker, bank or other agent. Please see the materials you received from your broker, bank or other agent for voting instructions. You may also vote during the Annual Meeting live via the internet by following the instructions posted at www.virtualshareholdermeeting.com/ZVO2020.ZVO2022.
Revocability of Proxies
If you are a stockholder of record, once you have submitted your proxy by mail, telephone or internet, you may revoke it at any time before it is voted at the Annual Meeting. You may revoke your proxy in any one of the following three ways:
•You may submit another proxy marked with a later date (which automatically revokes your earlier proxy) by mail or telephone or via the internet by the applicable deadline as described above;
•You may provide written notice that you wish to revoke your proxy to our Secretary at Zovio Inc, Attn: Secretary, 1811 E. Northrop Blvd, Chandler, AZ 85286 by no later than the close of business on May 12, 2020;June 14, 2022; or
•You may attend the Annual Meeting and submit your vote live via the internet. Attendance at the Annual Meeting live via the internet will not, by itself, cause your previously granted proxy to be revoked.
If you are a beneficial owner holding shares in street name, you may change your vote by submitting new voting instructions to your broker, bank or other agent in accordance with the instructions they provided (see “Voting Shares Registered in the Name of a Broker, Bank or Other Agent” above).
2
Tabulation of Votes
A representative from Broadridge Financial Solutions, Inc. will act as inspector of elections and tabulate the votes at the Annual Meeting. All shares represented by valid proxies received before the voting closes will be voted. If you submit a valid proxy containing instructions regarding how to vote with respect to any matter to be acted upon, your shares will be voted in accordance with those instructions. If you submit a valid proxy with no instructions, then your shares will be voted by the individuals we have designated as proxies for the Annual Meeting “FOR” the election of each of the Class III director nominees under Proposal 1, and “FOR” Proposal 2 and Proposal 3.2. In addition, the individuals that we have designated as proxies for the Annual Meeting will have discretionary authority to vote your shares with respect to any other business that may properly come before the Annual Meeting or any adjournment or postponement thereof.
Voting Results
Preliminary voting results are expected to be announced at the Annual Meeting. Voting results will be tallied by the inspector of elections and reported in a Current Report on Form 8-K (the “Form 8-K”) that we will file with the SEC within four business days of the Annual Meeting. If the voting results reported in the Form 8-K are preliminary, we will subsequently file an amendment to the Form 8-K to report the final voting results within four business days of the date on which the final voting results are known.
Proxy Solicitation
This proxy solicitation is made by the Board,Company, and we will bear the entire cost of soliciting proxies for the Annual Meeting, including costs associated with the preparation, assembly, printing and mailing of the proxy materials and any additional information furnished to stockholders. We will provide copies of the proxy materials to brokers, banks and other agents holding shares of our common stock in their name for the benefit of others for forwarding to the beneficial owners. We may reimburse such brokers, banks or other agents for their costs associated with forwarding the proxy materials to the beneficial owners. We have retained The Proxy Advisory Group, LLC (“Proxy Advisory Group”), which is owned by Alliance Advisors, a proxy advisory and solicitation firm, to assist with the solicitation of proxies and provide related advice and informational support, for a services fee, plus customary disbursements, which are not expected to exceed $20,000 in total. Proxy solicitations will be made primarily through the mail, but may be supplemented by telephone, facsimile, internet or personal solicitation by Proxy Advisory Group, or by our directors, executive officers, employees or other agents without additional compensation to such individuals.
Householding of Proxy Materials
The SEC has adopted rules that permit brokers, banks and other agents to satisfy the delivery requirements for proxy statements and annual reports by delivering a single notice of internet availability of proxy availabilitymaterials or proxy statement and annual report, as applicable, to two or more stockholders sharing the same address. This process, which is commonly referred to as “householding,” can provide added convenience for our stockholders and additional cost savings for us.
This year, a number of brokers, banks and other agents with account holders who are our stockholders will be householding our proxy materials. A single notice of internet availability of proxy availabilitymaterials or proxy statement and annual report, as applicable, will be delivered to multiple stockholders sharing an address unless contrary instructions have been received from the affected stockholders. Once you have received notice from your broker, bank or other agent that they will be householding communications to your address, householding will continue until you are notified otherwise or until you revoke your consent to the householding of communications. If at any time you no longer wish to participate in householding and would prefer to receive a separate notice of internet availability of proxy availabilitymaterials or proxy statement and annual report, please either (i) notify your broker, bank or other agent, (ii) direct your written request to Zovio Inc, Attn: Investor Relations, 1811 E. Northrop Blvd, Chandler, AZ 85286, or (iii) contact us by phone at (858) 668-2586 x11636.(866) 475-0317 x10003. Upon receipt of any such written or oral request, we undertake to promptly deliver free of charge a separate notice of internet availability of proxy availabilitymaterials or copy of the proxy statement and/or annual report, as applicable, to a stockholder at a shared address to which a single copy of these documents was delivered. Stockholders who currently receive multiple copies of the notice of internet availability of proxy availabilitymaterials or proxy statement and annual report at their address and would like to request householding of their communications should notify their broker, bank or other agent.
Stockholder Proposals for the 20212023 Annual Meeting of Stockholders
Stockholders may present proper proposals for inclusion in our proxy statement and for consideration at our next annual meeting of stockholders by submitting their proposals in writing to our Secretary in a timely manner, as described below.
3
For a stockholder proposal including a proposal for the nomination of directors, to be considered for inclusion in our proxy statement for the 20212023 Annual Meeting of Stockholders, our Secretary must receive the written proposal at our principal executive offices no later than December 3, 2020;January 20, 2023; provided, however, that in the event we hold the 20212023 Annual Meeting of Stockholders more than 30 days before or after the one-year anniversary of the Annual Meeting, we will disclose the new deadline by which stockholder proposals must be received in our earliest possible Quarterly Report on Form 10-Q or, if impracticable, by any means reasonably calculated to inform stockholders. In addition to being timely submitted, stockholder proposals must otherwise comply with the requirements of Rule 14a-8 of the Securities Exchange Act of 1934, as amended (the “Exchange Act”). Proposals should be addressed to: Zovio Inc, Attn: Secretary, 1811 E. Northrop Blvd, Chandler, AZ 85286.
Our bylaws also establish an advance notice procedure for stockholders who wish to nominate a director or present a proposal before an annual meeting of stockholders but do not intend for the nomination or proposal to be included in our proxy statement for such annual meeting of stockholders. For a stockholder to properly bring business before the 20212023 Annual Meeting of Stockholders, the stockholder must give timely notice thereof in writing to our Secretary, which notice must contain the information specified in our bylaws. To be timely, the written notice must be received at our principal executive offices:
•not earlier than the close of business on February 12, 2021;March 17, 2023; and
•not later than the close of business on March 15, 2021.April 17, 2023.
If we hold the 20212023 Annual Meeting of Stockholders more than 30 days before or after the one-year anniversary of the Annual Meeting, then in order to be timely, notice of a stockholder proposal that is not intended to be included in our proxy statement must be received:
•not earlier than the close of business on the 90th day prior to the 20212023 Annual Meeting of Stockholders; and
•not later than the close of business on the later of (i) the 60th day prior to the 20212023 Annual Meeting of Stockholders or (ii) if we first make a public announcement of the date of the 20212023 Annual Meeting of Stockholders fewer than 70 days before the date of such meeting, the close of business on the 10th day following the day on which we first make a public announcement of the date of the 20212023 Annual Meeting of Stockholders.
Stockholders are advised to review our bylaws, which contain additional requirements with respect to advance notice of stockholder proposals. If a stockholder who has notified us of his or her intention to present a proposal at an annual meeting of stockholders does not appear in person or by proxy at such meeting to present his or her proposal, we are not required to present the proposal for a vote at such meeting. While the Board will consider stockholder proposals that are properly brought before the 20212023 Annual Meeting of Stockholders, we reserve the right to omit from our proxy statement for the 20212023 Annual
Meeting of Stockholders proposals that we are not required to include under the Exchange Act, including Rule 14a-8 thereunder.
4
| SECURITY OWNERSHIP OF CERTAIN BENEFICIAL OWNERS AND MANAGEMENT | ||
The following table presents certain information with respect to the beneficial ownership of our common stock as of March 26, 2020April 22, 2022 by (i) each person we know to be the beneficial owner of 5% or more of our outstanding shares of common stock, (ii) each named executive officer and director and (iii) all executive officers and directors as a group. Information with respect to beneficial ownership is based on a review of our stock transfer records and on the Schedules 13D and 13G that have been filed with the SEC by or on behalf of the stockholders listed below. Except as indicated by the footnotes below, we believe, based on the information available to us, that the persons named in the table below have sole voting and investment power with respect to all shares of common stock that they beneficially own, subject to applicable community property laws.
Percentage of beneficial ownership is calculated based on 30,332,45034,075,329 shares of common stock outstanding on March 26, 2020.April 22, 2022. We have determined beneficial ownership in accordance with SEC rules. In computing the number of shares of common stock beneficially owned by a person and the percentage ownership of that person, we deemed as outstanding shares of common stock subject to stock options held by that person that are currently exercisable or exercisable within 60 days of March 26, 2020.April 22, 2022. We did not deem these shares outstanding, however, for the purpose of computing the percentage ownership of any other person. Except otherwise indicated in the footnotes below, the address of each beneficial owner listed in the table is Zovio Inc, 1811 E. Northrop Blvd, Chandler, AZ 85286.
| Number of Shares Held | Number of Shares Subject to Options Exercisable within 60 Days | Total Shares Beneficially Owned | ||||||||||||||||||||||||||||||
| Name of Beneficial Owner | Number | % | ||||||||||||||||||||||||||||||
| Principal Stockholders | ||||||||||||||||||||||||||||||||
| Nantahala Capital Management, LLC (1) | 2,980,767 | — | 2,980,767 | 8.7 | % | |||||||||||||||||||||||||||
| Royce & Associates (2) | 2,397,476 | — | 2,397,476 | 7.0 | % | |||||||||||||||||||||||||||
| SevenSaoi Capital Partners, LLC (3) | 2,069,761 | — | 2,069,761 | 6.1 | % | |||||||||||||||||||||||||||
| Heartland Advisors, Inc. (4) | 1,804,102 | — | 1,804,102 | 5.3 | % | |||||||||||||||||||||||||||
| Directors and Named Executive Officers | ||||||||||||||||||||||||||||||||
| Marc Brown (8) | 50,555 | — | 50,555 | * | ||||||||||||||||||||||||||||
| Teresa Carroll | 61,260 | — | 61,260 | * | ||||||||||||||||||||||||||||
| Andrew Clark (5)(8) | 1,222,044 | 550,422 | 1,772,466 | 5.1 | % | |||||||||||||||||||||||||||
| Michael Cole (6) | 25,856 | — | 25,856 | * | ||||||||||||||||||||||||||||
| Ryan Craig (7) | 35,300 | 27,804 | 63,104 | * | ||||||||||||||||||||||||||||
| Randy Hendricks | — | — | — | * | ||||||||||||||||||||||||||||
| Matthew Hillman | 5,810 | — | 5,810 | * | ||||||||||||||||||||||||||||
| Michael Horn | 70,710 | — | 70,710 | * | ||||||||||||||||||||||||||||
| Ron Huberman | — | — | — | * | ||||||||||||||||||||||||||||
| John Kiely | 63,010 | — | 63,010 | * | ||||||||||||||||||||||||||||
| Kirsten Marriner | 61,260 | — | 61,260 | * | ||||||||||||||||||||||||||||
| Matt Mitchell | 26,772 | 3,719 | 30,491 | * | ||||||||||||||||||||||||||||
| Victor Nichols (7) | 71,801 | 28,034 | 99,835 | * | ||||||||||||||||||||||||||||
| George Pernsteiner | 71,709 | — | 71,709 | * | ||||||||||||||||||||||||||||
| Kevin Royal | 138,591 | — | 138,591 | * | ||||||||||||||||||||||||||||
| John Semel | 39,206 | — | 39,206 | * | ||||||||||||||||||||||||||||
| Christopher Spohn (8) | 102,101 | — | 102,101 | * | ||||||||||||||||||||||||||||
| Diane Thompson (8) | 152,067 | — | 152,067 | * | ||||||||||||||||||||||||||||
| John Wilson | — | — | — | * | ||||||||||||||||||||||||||||
| All Directors and Executive Officers as a Group (16 Persons) | 830,524 | 126,368 | 956,892 | 2.8 | % | |||||||||||||||||||||||||||
| Number of Shares Held | Number of Shares Subject to Options Exercisable within 60 Days | Total Shares Beneficially Owned | ||||||||||
| Name of Beneficial Owner | Number | % | ||||||||||
| Principal Stockholders | ||||||||||||
| Nantahala Capital Management, LLC (1) | 2,653,087 | — | 2,653,087 | 8.7 | % | |||||||
| Schroder Investment Management, LTD (2) | 2,408,853 | — | 2,408,853 | 7.9 | % | |||||||
| Heartland Advisors, Inc. (3) | 2,277,450 | — | 2,277,450 | 7.5 | % | |||||||
| SevenSaoi Capital Partners, LLC (4) | 2,069,761 | — | 2,069,761 | 6.8 | % | |||||||
| Dimensional Fund Advisors, LP (5) | 2,045,918 | — | 2,045,918 | 6.7 | % | |||||||
| Prescott Group Capital Management, LLC (6) | 1,975,018 | — | 1,975,018 | 6.5 | % | |||||||
| Renaissance Technologies, LLC (7) | 1,869,258 | — | 1,869,258 | 6.2 | % | |||||||
| Directors and Executive Officers | ||||||||||||
| Teresa S. Carroll | 3,063 | — | 3,063 | * | ||||||||
| Andrew S. Clark (8) | 896,485 | 906,414 | 1,802,899 | 5.8 | % | |||||||
| Michael P. Cole | — | — | — | * | ||||||||
| Ryan D. Craig | 28,889 | 41,214 | 70,103 | * | ||||||||
| L. Dale Crandall | 43,176 | 41,214 | 84,390 | * | ||||||||
| Gregory K. Finkelstein (9) | 5,396 | — | 5,396 | * | ||||||||
| Michael B. Horn | 16,976 | — | 16,976 | * | ||||||||
| Kirsten M. Marriner | 3,063 | — | 3,063 | * | ||||||||
| Victor K. Nichols | 22,791 | 28,034 | 50,825 | * | ||||||||
| George P. Pernsteiner | 16,976 | — | 16,976 | * | ||||||||
| Kevin S. Royal | 38,609 | — | 38,609 | * | ||||||||
| All Directors and Executive Officers as a Group (20 Persons) | 1,254,300 | 1,408,097 | 2,662,397 | 8.4 | % | |||||||
(1) Based on the Schedule 13G, the address for Nantahala Capital Management, LLC is 130 Main St. 2nd Floor, New Canaan, CT 06840.
(2) Based on the Schedule 13G, the address for Royce & Associates, LP. is 745 Fifth Avenue, New York, NY 10151.
(3) Based on the Schedule 13D, the address for SevenSaoi Capital, LLC is 1165 North Clark Street, 4th Floor, Chicago, IL 60610. Mr. Cole is the Chief Executive Officer of SevenSaoi Capital, LLC. See also footnote (6) noted below.
(4) Based on the Schedule 13G, the address for Heartland Advisors, Inc. is 790 North Water Street, Suite 1200, Milwaukee, WI 53202.
5
(5) Mr. Clark was the Company’s Chief Executive Officer and an employee until March 31, 2021, and was a director of the Company until March 22, 2021. Includes 513,444 shares of common stock held by the Clark Family Trust, dated July 8, 1998.
(6) Mr. Cole is the Chief Executive Officer of SevenSaoi Capital, LLC. See also footnote (3) noted above.
(7) Messrs. Craig and Nichols resigned from our board of directors effective May 11, 2022 and May 12, 2022, respectively.
(8) Messrs. Brown, Clark and Spohn and Ms. Thompson were no longer employees of the Company as of the mailing of this proxy statement.
6
| PROPOSAL 1 | ||
ELECTION OF DIRECTORS
Board Composition
As of the date of this proxy statement, the Board consists of tennine members. Our bylaws provide that the number of directors will be fixed from time to time by resolution of the Board. All directors hold office until their successors have been elected and qualified or until their earlier death, resignation, disqualification or removal. We have divided the terms of office of the directors into three classes:
•Class I, whose term expires at the 2022 Annual Meeting of Stockholders;
•Class II, whose term expires at the 20202023 Annual Meeting of Stockholders; and
•Class III, whose term expires at the 20212024 Annual Meeting of Stockholders.
Class I consists of Ron Huberman, John J. Kiely Victor K. Nichols and George P. Pernsteiner, Class II consists of Michael P. Cole, L. Dale Crandall, Ryan D. Craig and Michael B. Horn and John S. Wilson and Class III consists of Andrew S. Clark, Teresa S. Carroll, Randy J. Hendricks and Kirsten M. Marriner. Victor K. Nichols was a Class I director until his resignation effective May 12, 2022 and Ryan D. Craig was a Class III director until his resignation effective May 11, 2022.
At each annual meeting of stockholders, the successors to directors whose terms then expire will serve from the time of election and qualification until the third annual meeting following election and until their successors are duly elected and qualified. Any additional directorships resulting from an increase in the number of directors will be distributed among the three classes so that, as nearly as possible, each class will consist of one third of the directors.
Nominees for Election at the Annual Meeting
The Nominating and Governance Committee recommended, and the Board nominated, MichaelRon Huberman, John J. Kiely and George P. Cole, Ryan D. Craig and Michael B. HornPernsteiner as nominees for election to the Board as Class III directors at the Annual Meeting. If elected, MichaelRon Huberman, John J. Kiely and George P. Cole, Ryan D. Craig and Michael B. HornPernsteiner will continue as directors and their terms will expire at the 20232025 Annual Meeting of Stockholders.
Information about the Board of Directors
The names, ages as of December 31, 2019,2021, and certain information regarding each member of the Board, including the nominees for election to the Board as Class III directors at the Annual Meeting, are set forth below. The following information has been furnished to us by the directors.
Teresa S. Carroll, age 54,56, has served as a director of our company since March 2018. Ms. Carroll is a former President for Kelly Services, Inc., and Oasis, a global leader inPaychex Company. Ms. Carroll is also a board member for Bayada, a home healthcare company and ProUnlimited, a contingent workforce management solutions.company. Ms. Carroll earned a B.S. in Industrial Engineering from GMIthe G.M.I. Engineering and Management Institute (now Kettering) and an M.B.A. from the University of Michigan. Ms. Carroll brings to the Board deep understanding of talentoperational and skilltalent challenges in the life sciences, energy, manufacturing, finance and insurance, consumer goods, and various other industries gained through her experience driving strategy, operations, sales, marketing and human resources for Kelly Services, Inc.large public companies.
Michael P. Cole, age 47,49, has served as a director of our company since January 2020. Mr. Cole foundedcurrently serves as Chief Executive Officer of SevenSaoi Capital (“7C”(pronounced “7C”), an investment management firm, in 2016.since March 2016, and Chief Financial Officer of eMed LLC, a digital healthcare company since December 2021. Previously, Mr. Cole served as President of MAEVA Group, a turnaround-oriented merchant bank. Prior thereto, Mr. Colebank and was also with Madison Dearborn Partners, a Chicago-based private equity firm that manages $23 billion in equity capital, for nearly 17 years.years, retiring as Managing Director. Mr. Cole does not currently serves as a director of Univision Communications, Inc. andserve on any other public boards, but has alsopreviously served on the boards of a number of other companies, includingUnivision Communications, Inc., Merge Healthcare Inc., MetroPCS Communications and The Topps Company.Company, among others. Mr. Cole also worked in a senior-level role on Madison Dearborn’s investments in technology-enabled service companies such as Intelsat, Ltd. and XMX.M. Satellite Radio. Mr. Cole was named a “Top 40 Global Dealmaker under 40” by Dealmaker Magazine and a “Top 40 Under 40” business leader by Crain’s Chicago Business. Mr. Cole received his A.B. degree from Harvard College.
7
transformation through focused execution, in challenging and highly competitive market segments with companies looking to our Boardre-establish growth. Mr. Hendricks brings a global perspective and a keen knowledge of different markets and cultures, through previous operating roles when based in London, Tokyo, and Madrid. Mr. Hendricks' experience includes over 20 years working with clients in higher education institutions assisting them to advance their academic and research missions. Prior to joining Zovio, Mr. Hendricks was a Senior Executive at the Annual Meeting.Huron Consulting Group. Before joining Huron, Mr. Crandall founded Piedmont Corporate Advisors, Inc., a private financial consulting firm, in 2003 and currently serves as its President. From April 2000 to June 2002, Mr. CrandallHendricks served as President of Education & Government at Workday. Mr. Hendricks held multiple senior leadership roles in IBM’s Global Business Services unit, both in the PresidentU.S. and Chief Operating Officer of Kaiser Foundation Health Plan Inc. and Kaiser Foundation Hospitals. From June 1998 to March 2000,internationally. Mr. Crandall served as the Senior Vice President and Chief Financial Officer of Kaiser Foundation Health Plan Inc. and Kaiser Foundation Hospitals. Mr. CrandallHendricks also serves as a directorboard member for Endurance International Group, Inc. and one private company. Within the last five years,several technology companies. Mr. Crandall also served asHendricks holds a director for Ansell Limited and Coventry Health Care, Inc. and as lead trustee for The Dodge & Cox Mutual Funds.B.S. in Industrial Administration with a minor in Computer Science from Iowa State University. Mr. Crandall earned a B.A. from Claremont McKenna College and an M.B.A. fromHendricks obtained his CPA after taking advanced accounting courses at the University of California, Berkeley, and is a certified public accountant (inactive). Mr. Crandall brings to the Board a strong foundation in financial reporting and accounting matters for complex organizations, as well as executive leadership and management experience.Illinois.
Michael B. Horn, age 40,42, has served as a director of our company since August 2017. Mr. Horn currently serves as the owner of Horn-Ed LLC, serving as Board Member, advisor, and consultant to a portfolio of education companies. Mr. Horn has also been a Venture Partner for Nextgen Venture Partners since 2017. Mr. Horn has served as the Chief Strategy Officer and Senior Partner at The Entangled Group and Entangled Solutions sincefrom October 2015 to May 2020, and as Co-Founder, Distinguished Fellow, and Board Member of Clayton Christensen Institute for Disruptive Innovation since October 2015. The Entangled Group was acquired in May 2020 by Guild Education, where Mr. Horn now serves as a senior strategist. Previously, Mr. Horn served as Co-Founder and Executive Director, Education, of the Clayton Christensen Institute for Disruptive Innovation from 2007 through October 2015. Mr. Horn earned a B.A. in History from Yale University and an M.B.A. from the Harvard Business School. Mr. Horn brings to the BroadBoard significant expertise in innovation across sectors with a deep focus on innovation and quality assurance in higher education and its strategic and organizational implications.
Ron Huberman, age 50, has served as a director of our company since March 2021. Mr. Huberman currently serves as the Chief Executive Officer of Benchmark Analytics, a provider of enterprise human capital management software and learning management. Mr. Huberman was a Senior Advisor for PeopleAdmin, a human capital software company, from 2016 to 2018. Mr. Huberman was also the Founder and Executive Board Chair for TeacherMatch from 2012 to 2016, which provides online predictive hiring tools for the K-12 market. Mr. Huberman has also held executive roles at Prairie Capital as well as within the Chicago Public Schools, Chicago Transit Authority, Chicago Office of the Mayor and Chicago Police Department. Mr. Huberman earned his B.A. from the University of Wisconsin and both his M.A. and M.B.A. from the University of Chicago. Mr. Huberman currently serves on the boards of Benchmark Analytics, Learner's Edge and Right-at-School. Mr. Huberman brings to the Board a deep knowledge of business and a special focus on human capital management.
John J. Kiely, age 61,63, has served as a director of our company since July 2019. Mr. Kiely was also named to the board ofcurrently serves as a director for Amneal Pharmaceutical in December 2019.and Covis Group Pharmaceutical. Mr. Kiely retired from PricewaterhouseCoopers LLP in 2019 where during2019. During his 39-year career, he had significant leadership roles, including Assurance Chief Quality Officer, Assurance Leader of the Private Equity Sector, and Leader of the U.SU.S. Pharmaceutical Industry. Additionally, he had extensive experience working with Fortune 500 companies and Private Equity portfolio companies. Mr. Kiely earned a B.A. from St. Francis University (Pa) and is a certified public accountant. Mr. Kiely brings to the Board a deep knowledge of business, as well as expertise in the areas of finance and accounting, corporate governance and strategic planning.
Kirsten M. Marriner, age 47,49, has served as a director of our company since March 2018. Ms. Marriner is the executive vice presidentExecutive Vice President - chief people officerChief People and Corporate Affairs Officer of the Clorox Company, a position she has held since March 2016. Prior to joining the Clorox Company, she served as senior vice president and chief human resources officer at Omnicare, from March 2013 to August 2015. She served in various leadership roles, including as senior vice president, director of talent management and development at Fifth Third Bank, from October 2004 to March 2013. She has held human resources leadership roles at KeyCorp and worked in the human capital consulting practices at Deloitte and KPMG. Ms. Marriner earned a B.S. in Industrial/Organizational Psychology from John Carroll University and an M.B.A. from Cleveland State University. Ms. Marriner brings to the Board her executive leadership experience with Fortune 500 companies across a variety ofvarious industries and expertise on human resources.
George P. Pernsteiner, age 71,73, has served as a director of our company since August 2017. Mr. Pernsteiner has over 28 years of experience serving in several leadership posts in the post-secondary education system. From September 2013 through August 2017, he served as President of the State Higher Education Executive Officers Association, which represents chancellors and commissioners of higher education from every state. Mr. Pernsteiner also served as Chancellor of the Oregon University System from July 2004 through May 2013. Mr. Pernsteiner has a B.A. in Political Science from Seattle University and an M.P.A. from the University of Washington in Public Administration. Mr. Pernsteiner brings to the Board his broad experience in managing universities and in developing and advancing education policies and practices.
John S. Wilson, age 64, has served as a director of our company since March 2021. Mr. Wilson is a visiting scholar at the Harvard Business School, and is currently on leave from the Board of Overseers at Harvard University. Mr. Wilson was previously a Senior Advisor to the President of Harvard from April 2018 to September 2020, and the President in Residence to
8
the Harvard School of Education from August 2017 to April 2018. Prior to that, Mr. Wilson also served as the President of Morehouse College from 2013 to 2017. Additionally, Mr. Wilson served as the Executive Director of the White House initiative on Historically Black Colleges and Universities (HBCUs) from 2009 to 2013. Mr. Wilson has also held Executive Dean and Associate Professor roles at the George Washington University, as well as Director positions at the Massachusetts Institute of Technology (MIT). Mr. Wilson earned his B.A. from Morehouse College and a Masters in Education and Masters in Theological Studies from Harvard. Mr. Wilson also earned his Doctorate in Education from Harvard Graduate School of Education. Mr. Wilson brings to the Board his vast experience in the higher education industry and governmental policy.
| Carroll | Cole | Horn | Huberman | Kiely | Marriner | Pernsteiner | Wilson | ||||||||||||||||||||||
| SKILLS AND EXPERIENCE | |||||||||||||||||||||||||||||
 | Public Company Executive Leadership Directors who have held leadership positions with an understanding of the considerations that are unique to a public company | * | * | * | * | * | |||||||||||||||||||||||
 | Strategic Planning and Transformation Directors with experience setting long-term corporate vision and direction, desirable products and customer segments, and evaluating competitive positioning | * | * | * | * | * | * | * | |||||||||||||||||||||
 | Finance and Accounting Directors with experience in evaluating financial statements, capital structure and financial strategy | * | * | * | * | ||||||||||||||||||||||||
 | Industry Experience Directors with experience in the industry and markets served by the Company and offer valuable perspective for operations | * | * | * | * | ||||||||||||||||||||||||
 | Risk Management Directors with experience in overseeing the challenges and potential disruptors facing the Company | * | * | * | * | * | * | * | * | ||||||||||||||||||||
 | Human Capital Management Directors with experience in succession planning, attracting, developing, motivating and retaining high-performing talent | * | * | * | * | ||||||||||||||||||||||||
 | Government / Policy / Regulatory Directors with experience with public policy, governmental affairs, and highly-regulated industries | * | * | * | * | * | * | * | * | ||||||||||||||||||||
 | Corporate Governance Directors with experience in assuring transparency, accountability and board effectiveness | * | * | * | * | * | * | * | * | ||||||||||||||||||||
9
| BOARD DIVERSITY MATRIX | |||||||||||||||||
| Total Number of Directors | 9 | ||||||||||||||||
| Part I: Gender Identity | Female | Male | Non-Binary | Did not disclose | |||||||||||||
| Directors | 2 | 6 | 0 | 1 | |||||||||||||
| Part II: Demographic Background | |||||||||||||||||
| African American or Black | 0 | 1 | 0 | 0 | |||||||||||||
| Alaskan Native or Native American | 0 | 0 | 0 | 0 | |||||||||||||
| Asian | 0 | 0 | 0 | 0 | |||||||||||||
| Hispanic or Latinx | 0 | 0 | 0 | 0 | |||||||||||||
| Native Hawaiian or Pacific Islander | 0 | 0 | 0 | 0 | |||||||||||||
| White | 2 | 5 | 0 | 0 | |||||||||||||
| Two or More Races or Ethnicities | 0 | 0 | 0 | 0 | |||||||||||||
| LGBTQ+ | 1 | ||||||||||||||||
| Did Not Disclose Demographics | 1 | ||||||||||||||||
Vote Required
Directors are elected by a plurality of the votes present in person or represented by proxy and entitled to vote at a meeting at which a quorum is present. Shares represented by proxy will be voted, if authority to do so is not withheld, for the election of the three nominees for election as Class III directors named above. Abstentions and broker non-votes will be counted as present for purposes of determining the presence of a quorum. If a quorum is present, the three nominees for Class III director receiving the highest number of votes will be elected as Class III directors. Abstentions and broker non-votes will have no effect on the outcome of the vote. The proxy holdersNeither stockholders nor proxies may not vote the proxies for a greater number of persons than the number of nominees named. If any nominee should be unavailable for election as a result of an unexpected occurrence, shares will be voted for the election of such substitute nominee as the Board may propose. Each person nominated for election has agreed to serve if elected, and the Board has no reason to believe that any nominee will be unable to serve.
THE BOARD UNANIMOUSLY RECOMMENDS A VOTE “FOR” THE ELECTION
AS A CLASS III DIRECTOR OF EACH NOMINEE LISTED ABOVE.
10
| CORPORATE GOVERNANCE | ||
Director Independence
The Board has affirmatively determined that Ms.Mmes. Carroll Ms.and Marriner and Messrs. Cole, Crandall, Craig, Horn, Huberman, Kiely Pernsteiner and NicholsWilson have no material relationships with us (either directly or as a partner, stockholder or officer of an organization that has a relationship with us) and, accordingly, each of the foregoing members of the Board were determined to be independent under the rules of The NASDAQNasdaq Stock Exchange (“Nasdaq”). Mr. ClarkPernsteiner was not independent during the time he served as a member of the Office of the CEO from March 31, 2021 through December 6, 2021. Mr. Hendricks is not independent under Nasdaq rules because he is employed by us.also currently serving as the Chief Executive Officer.
In determining whether directors were independent under Nasdaq rules, the Board considered the matters discussed in the section entitled “Certain Relationships and Related Transactions” below. There are no family relationships between any of our directors and executive officers. There are currently no legal proceedings, and during the past ten years there have been no legal proceedings, that are material to the evaluation orof the ability or integrity of any of our directors or director nominees.
Leadership Structure of the Board of Directors
Pursuant to our bylaws and Corporate Governance Guidelines, the Board has the following general leadership structure:
•The positions of Chief Executive Officer and Chairman of the Board are separate, but may be held by the same individual. The positionsposition of Chief Executive Officer andis currently held by Mr. Hendricks. The position of Chairman of the Board areis currently held by Messrs. Clark andMr. Pernsteiner. From March 31, 2021 through December 6, 2021, Mr. Pernsteiner, respectively.was deemed not to be independent due to his interim service as a member of the Office of the CEO.
•The Chairman of the Board presides at meetings of the Board and, so long as the Chairman of the Board is an independent director, also presides at executive sessions of the non-management and/or independent directors. The Company’s current Chairman of the Board.
•The Chief Executive Officer and the Chairman of the Board jointly establish the agenda for each meeting of the Board, though any director may request the inclusion of items on the agenda.
•If the Chairman of the Board is not an independent director, the independent directors will appoint one independent director to serve as “lead independent director.” In that scenario, the lead independent director will preside at executive sessions of the non-management and/or independent directors, preside at meetings of the Board in the absence of the Chairman of the Board, review agendas for meetings of the Board with the Chief Executive Officer and Chairman of the Board, and assume such other functions as the Board may deem appropriate.
Our Corporate Governance Guidelines are available on our website at http://www.zovio.com under “Investors - Governance.”
Board Committees
The Board has an active Audit Committee, a Compensation Committee, a Nominating and Governance Committee and an M&A Oversight Committee. These committees operate under written charters, which are available on our website at http://www.zovio.com under “Investors - Governance.” The Board has determined that all members of these committees satisfy the applicable independence requirements under Nasdaq rules, as necessary.rules. The members of the committees are identified in the table below. In connection with the Annual Meeting, L. Dale Crandall will retire from our Board and is not standing for re-election. After the date of the Annual Meeting, Mr. Crandall will no longer be a member of the Audit Committee, Compensation Committee or M&A Oversight Committee.
11
| Director | Audit Committee | Compensation Committee | M&A Oversight Committee | Nominating and Governance Committee | ||||||||||||||||||||||||
| Teresa | Member | — | — | — | ||||||||||||||||||||||||
| Michael | — | Member | Member | — | ||||||||||||||||||||||||
| Randy Hendricks | — | |||||||||||||||||||||||||||
| — | Chair | — | ||||||||||||||||||||||||||
| Michael Horn | — | — | — | Chair | ||||||||||||||||||||||||
| Member | — | |||||||||||||||||||||||||||
| — | — | |||||||||||||||||||||||||||
| John | — | — | Member | |||||||||||||||||||||||||
| Kirsten Marriner | — | Chair | — | — | ||||||||||||||||||||||||
| — | Member | — | ||||||||||||||||||||||||||
| — | ||||||||||||||||||||||||||||
| — | — | Member | ||||||||||||||||||||||||||
The Audit Committee is responsible primarily for overseeing (i) the services provided by our independent registered public accounting firm, (ii) the integrity of our financial statements and internal control over financial reporting, and (iii) risk management, internal audit and our compliance with legal and regulatory requirements. Mr. Crandall,Kiely, the Chair of the Audit Committee, has been determined by the Board to be an audit committee financial expert. Mr. Kiely, who is expected to be appointed the Chair of the Audit Committee, has also been determined by the Board to be an audit committee financial expert. The Audit Committee held eleveneight meetings in 2019.2021.
The Compensation Committee is responsible primarily for evaluating and approving all compensation plans, policies and programs as they affect our executive officers, administering our equity compensation plans, and reviewing the compensation of the Board. The Compensation Committee held elevenfifteen meetings in 2019.2021.
The Nominating and Governance Committee is responsible primarily for identifying, evaluating and recommending to the Board, nominees for election or appointment to the Board and committees of the Board, evaluating the performance and independence of the Board and of individual directors, and evaluating the adequacy of our corporate governance practices. The Nominating and Governance Committee held fourfive meetings in 2019.2021.
The M&A Oversight Committee is responsible primarily for evaluating strategies for near-term and long term value and considering other strategic transactions involving the Company, including but not limited to a business combination transaction, a sale of an entity, or recapitalization or similar transaction. The M&A Oversight Committee held fiveseven meetings in 2019.2021.
Meetings of the Board of Directors and Board Committees
The Board has regularly scheduled meetings at least quarterly, and theholds additional meetings as needed. The committees of the Board usually meet at leastquarterly and hold additional meetings as often.needed. Our independent directors hold executive sessions without management present at least once per quarter. During 2019,2021, the Board held tenthirteen meetings.
Each director who served during 2021 attended at least 75% of the aggregate number of meetings held by the Board and all applicable committees of the Board during the period that he or she served. It is our policy to encourage membersMembers of the Board toof Directors traditionally attend our annual meetings of stockholders;stockholders. In 2021, all directors at that time, except for one,who served during 2021 attended the 2019 Annual Meeting of Stockholders.Stockholders, held virtually.
Role of the Board of Directors in Risk Oversight
Management is responsible for day-to-day risk management at our company. The role of the Board is to provide oversight of the processes designed to identify, assess and monitor key risks and risk mitigation activities. The Board fulfills its risk oversight responsibilities through (i) a robust Enterprise Risk Management process that incorporates the views on risk of employees of all levels in their areas and culminates in a board presentation on key risks and mitigation strategies each quarter, (ii) the receipt of reports directly from managers responsible for the management of particular business risks and (ii)(iii) the receipt of reports from each committee chair regarding such committee’s oversight of specific risk topics.
Delegation of Risk Oversight
The Board has delegated oversight of specific risk areas to its committees. For example, the Audit Committee is tasked with overseeing risk management at our company with respect to financial matters and the adequacy of our internal control over financial reporting. Pursuant to its charter, the Audit Committee is required, among other things, to discuss with management our policies with respect to risk assessment and risk management, including guidelines and procedures to govern the process by which risk assessment and risk management are handled, and to review our major risk exposures and the steps management has taken to monitor, control and report such exposures. The Audit Committee typically has these discussions with management at
12
least once per quarter, and the Chair of the Audit Committee subsequently reports on these discussions to the full Board. Similarly, the Compensation Committee assists the Board in overseeing risks arising from our compensation
policies and practices, and the Nominating and Governance Committee assists the Board in overseeing risks associated with corporate governance, director and executive officer succession planning, board membership and board structure. The Board then discusses significant risk management issues with the Chief Executive Officer and other members of the management team and recommends appropriate action.
Enterprise Risk Management
At the direction of the Board and the Audit Committee, we have developed and implemented an enterprise risk management (“ERM”) process. The ERM process is managed by a steering committee comprised of representatives from each of our company’s principal business units in consultation with our executive team. The ERM steering committee meets at least quarterly to evaluate current risks, identify new risks, quantify the likelihood and potential impact of such risks, and develop mitigation plans for such risks. Additionally, each quarter the executive team presents to, and receives feedback from, the Board regarding our outstanding risks and related mitigation plans.
Environmental, Social and Governance MattersPrograms
Environmental, social and governance (“ESG”) refers to the three central factors in measuring the sustainability and societal impact of an investment in our company.investment. These criteria, and the activities making up each area, have long been a part of the way we operate. The way we approach sustainability at our facilities, the way we interact with our communities, the process by which we make decisions and our people firstpeople-first culture all contribute to our ESG program. You
Environmental Matters
We provide our services primarily online, which inherently results in a friendlier impact on the environment. As a leader in education technology services, we can read more abouthelp drive sustainability through our products and services. Our programs are 100% online, and courseware is 100% digital.
Optimizing and conserving our resources through sustainable practices are at the center of our Company’s focus on the environment. With a mindset of continuous improvement, we focus on sustainability by using industry-leading technologies within our facilities to minimize the impact on the environment where applicable. We have many initiatives in the areas of conserving energy and reducing waste at our facilities. Our Arizona-based headquarters is 130,000 square-feet and generates approximately 480kWh of solar power annually that provides at least 30% of the building's electricity needs. The facility also includes 24 electric car charging stations on site, and energy-efficient LED lighting throughout the building. Additionally, there is an approximately 100 square foot biophilic plant wall in the building. Efforts such as this helped us in being awarded the 2020 Arizona Red Award for Office Interiors Project of the Year. We have also identified and implemented methods that improve resource conservation and maintain compliance with the U.S. Green Building Council, in addition to federal, state, and local regulations.
Additionally, we believe the facilities we occupy are state-of-the-art and are in substantial compliance with federal, state and local laws and regulations that have been enacted or adopted regulating the discharge of materials into the environment or otherwise relating to the protection of the environment. Compliance with these laws and regulations has not had, and is not expected to have, a material effect on our ESG highlights, accomplishments,capital expenditures, results of operations, or competitive position.
Human Capital Management and Social Awareness
A key pillar of our corporate strategy is attracting, developing, and retaining top talent with a shared purpose to help everyone be in a class of their own. The Company is committed to building a culture where ambitious individuals can come together to create innovative solutions for a brighter future. We subscribe to a set of beliefs—make meaningful connections, craft exceptional experiences, all voices matter, develop bold ideas—that guide how we interact, champion change, and inspire others.
In 2020 and 2021, the COVID-19 pandemic had a direct impact on our employees. We pivoted the vast majority of our workforce to remote work with minimal disruption while implementing additional safety measures for employees conducting critical on-site work. Despite the challenging economic realities brought on by the pandemic, Zovio hired almost 600 employees in fiscal year 2021, hiring workers from many of the community’s hardest-hit industries. To minimize risk to employees, the majority of new hires in 2021 were onboarded and trained remotely, with the rest being trained in a socially distanced, safe environment. New hires obtained all the necessary tools and resources to be successful in a remote setting through our creative curbside pick-up process. We also offered flexible work schedules and offered additional time off for those with medical and caregiving needs due to COVID-19.
13
As of December 31, 2021, the Company and its subsidiaries employed approximately 1,400 individuals, 1,365 of which were full-time. This includes staff in university services, academic advising and academic support, enrollment services, university administration, financial aid, marketing, information technology, human resources, legal and compliance, external affairs, corporate accounting, finance and other administrative functions. At the conclusion of 2021, Zovio’s workforce was 57% female and 43% male and women represented 52% of those in leadership roles.
To attract, retain, and inspire our talent, we offer fair, competitive compensation and award-winning benefits programs that support our employees through the entire employee lifecycle. Our compensation and benefits program includes: base pay, short-term incentives, cash and stock-based long-term incentives, an employee savings plan that qualifies as a deferred salary arrangement under Section 401(k) of the Internal Revenue Code of 1986, as amended, with an employer match, an employee stock purchase plan, health and wellness benefits, health savings accounts, flexible spending accounts, paid time off, paid parental leave, an award winning wellness program and an employee assistance program. Additionally, we offer an on-site gym and café with healthy food alternatives, a fully-staffed Health and Wellness Center, lifestyle coaching, ergonomic programs, and initiativesfinancial education and coaching to help employees reach their personal financial goals. The Company also benchmarks positions and regularly reviews the design of employee compensation and benefits programs to ensure we remain competitive with the market. We undertake an external third-party facilitated pay equity analysis annually and conduct regular internal assessments on pay disparities and make adjustments as necessary.
Creating a culture that embraces diversity, where all employees feel supported and valued, is paramount to delivering innovative solutions to our websiteuniversity partners and students. Our employees participate in an annual survey to measure overall engagement. In 2021, 87% of Zovions reported that they feel cared about as a person and 74% reported that they intend to stay at http://www.zovio.com/our-story/corporate-social-responsibility.Zovio.
In 2021, we launched “Belonging @ Zovio” – our Diversity and Inclusion strategy. One of its key pillars is “bringing collective voices together” which is activated by connecting those with similar interests and passions through Employee Resource Groups. These groups focus on professional development & networking opportunities, volunteer activities, raising awareness, and providing insights that inform our products and services.
The Company is committed to developing its people where employees are empowered to drive their own career progression. The Company provides training to its employees annually, focusing on on-the-job development and on-demand learning. For those interested in taking on leadership roles, our Leadership Education and Development (“LEAD”) program is designed to provide new leaders with the basic tenants of leading, ensuring they are well-supported as they take on this important role in the organization.
To support personal and professional growth, Zovio offers employees an opportunity to obtain their bachelor’s and/or master’s degree for free through our university partner, University of Arizona Global Campus. The Company also has several tuition reimbursement programs. We provide a tuition benefit, up to $5,250 annually, alongside a College Savings 529 Plan and Student Debt Repayment program for eligible employees. We also offer free online tutoring services for employees and their dependents as many parents turned to virtual learning during the COVID-19 pandemic.
During 2021, Zovio supported the Arizona Coronavirus Relief Fund, Chandler Chamber of Commerce’s COVID-19 Relief Program, United Way Workplace Campaign, food drives, community laptop drives, and provided materials to support online instruction to our educational partners.
We understand the life-changing impact that education resources can have on individuals, no matter their background, experience, or career goals. Zovio supports nonprofit organizations aligned with our pillars of “Opportunities for All” and “Learning Beyond the Classroom” through our Corporate Giving program. In 2021, Zovio supported various educational partners including Arizona Tech Council, Greater Phoenix Chamber Foundation, Jobs for Arizona’s Graduates, Center for the Future of Arizona, Wounded Warriors Project, and The Johnston Family Foundations for Urban Agriculture. All Zovio employees are provided 16 hours of paid time off to volunteer at nonprofit organizations of their choice. In 2021, Zovio employees logged more than 3,100 volunteer hours, either virtually or in person.
Our culture is anchored in a long-standing commitment to giving back to the communities in which our employees live and work. Since 2005, the Company has donated over $11 million in charitable contributions. Our employees have collectively given 160,000 hours in volunteer efforts and have generously donated over $2.2 million through workplace giving campaigns.
14
Governance Standards
Management of the Company is led by talented leaders with deep experience in education and technology. The Board of Directors of the Company sets high standards for the Company's employees, officers and directors. Implicit in this philosophy is the importance of sound corporate governance. It is the duty of the Board of Directors to serve as a prudent fiduciary for stockholders and to oversee the management of the Company's business. To fulfill its responsibilities and to discharge its duty, the Board of Directors follows the procedures and standards that are set forth in our Corporate Governance Guidelines, committee charters and other governance documents. See further information below in the “Executive Officers” section below.
Recoupment Policy
To help mitigate risk, the Board has adopted a Policy on Recoupment of Compensation (the “Recoupment Policy”) pursuant to which certain key employees may be directed to return to us performance-based compensation they previously received if either:
•there is a restatement of any of our financial statements previously filed with the SEC (regardless of whether there was any misconduct), other than those due to changes in accounting principles, and the restated financial results would have resulted in a lesser amount of performance-based compensation being paid to them; or
In the event of a restatement of our financial statements, the Compensation Committee will review performance-based compensation awarded or paid to the key employees that was attributable to performance during the applicable time periods. To the extent permitted by applicable law, the Compensation Committee will make a determination as to whether, and how much, compensation is to be recouped by us on an individual basis. If there has been no misconduct as described above, any recoupment of compensation will be limited to a three-year lookback period from the date the financial or accounting irregularity was discovered by us and brought to the attention of the Compensation Committee.
Moreover, if the Compensation Committee determines that a key employee has engaged in misconduct, the Compensation Committee may take such actions with respect to such employee as it deems to be in our best interests and necessary to remedy the misconduct and prevent its recurrence. To the extent permitted by applicable law, such actions can include, among other things, recoupment of compensation (which would not be limited to the three-year lookback period referenced above), adjustment of future compensation, cancellation of grants or vesting of equity-based compensation, recoupment of profits gained by such employee on any stock issued to such employee regardless of when issued, and/or disciplinary actions up to and including termination of employment. The Compensation Committee’s power to determine the appropriate remedy is in addition to, and not in replacement of, remedies imposed by law enforcement agencies, regulators or other authorities.
Communications with the Board of Directors
We have adopted a formal process by which security holders and other interested parties may communicate with the Board, which policy is available on our website at http://www.zovio.com under “Investors - Governance.” Interested parties may send communications to the non-management members of the Board. Communications to the Board must either be in
writing and sent care of the Secretary by mail to our offices at 1811 E. Northrop Blvd, Chandler, AZ 85286, or delivered via e-mail to secretary@zovio.com. This centralized process will assist the Board in reviewing and responding to stockholder and interested party communications in an appropriate manner. The name of any specific intended recipient should be noted in the communication. All communications must be accompanied by the following information:
•if the person submitting the communication is a security holder, a statement of the type and amount of securities of our company the person holds;
•if the person submitting the communication is not a security holder and is submitting the communication to the non-management directors as an interested party, the nature of the person’s interest in our company;
•any special interest, meaning an interest not in the capacity of a stockholder of our company, of the person in the subject matter of the communication; and
•the address, telephone number and e-mail address, if any, of the person submitting the communication.
15
Communications should be addressed to the attention of the Secretary and should not exceed 500 words in length, excluding the information required to accompany the communication as described above. The Board has instructed the Secretary to forward such correspondence to the Board; however, before forwarding any correspondence, the Board has also instructed the Secretary to review such correspondence and, in the Secretary’s discretion, not to forward certain items if they are deemed of a personal, illegal, commercial, offensive or frivolous nature or otherwise inappropriate for director consideration.
Consideration of Director Nominees
Director Qualifications
The Nominating and Governance Committee evaluates all incumbent, replacement or additional nominees for election as directors, taking into account (i) all factors the committee considers appropriate, which may include career specialization, relevant technical skills or financial acumen, diversity of viewpoint and industry knowledge, and (ii) the following minimum qualifications:
•Each director nominee must have displayed the highest personal and professional ethics, integrity and values, and sound business judgment;
•Each director must be highly accomplished in his or her respective field, with superior credentials and recognition and broad experience at the administrative and/or policy making level in business, government, education, technology or public interest;
•Each director must have relevant expertise and experience, and be able to offer advice and guidance to the Chief Executive Officer based on that expertise and experience;
•Each director must be able to represent all of our stockholders and be committed to enhancing long-term stockholder value; and
•Each director must have sufficient time available to devote to activities of the Board and to enhance his or her knowledge of our business.
In determining whether to recommend a director for re-election to the Board, the Nominating and Governance Committee also considers the director’s past attendance at meetings and participation in and contributions to the activities of the Board and any applicable committees of the Board.
The Nominating and Governance Committee has also determined that no person may be nominated or elected for directorship if he or she has attained the age of 75; provided that if a director reaches the age of 75 after he or she has been elected as a director, he or she may remain a director until his or her term has expired and his or her successor is elected and shall qualify.
The Nominating and Governance Committee does not haveacknowledges and are aware of the importance of diversity as a formal policy governing the consideration of diversity in identifying nominees for director. The Board seeks to employ members that are divers in their perspectives, backgrounds and experiences.
Stockholder Recommendations and Nominees
The Nominating and Governance Committee has not received director candidate recommendations from our stockholders and does not have a formal policy regarding consideration of such recommendations. The Board believes this is appropriate, as
To be considered, the recommendation of a director candidate must include the following written information: (i) the stockholder’s name and contact information; (ii) a statement that the writer is a stockholder and is proposing a candidate for consideration by the Nominating and Governance Committee; (iii) the name of, and contact information for, the candidate and a statement that the candidate is willing to be considered and serve as a director, if nominated and elected; (iv) a statement of the candidate’s business and educational experience and qualifications; (v) information regarding each of the factors listed under “Director Qualifications” above sufficient to enable the Nominating and Governance Committee to evaluate the candidate; (vi) a statement of the value that the candidate would add to the Board; (vii) a statement detailing any relationship between the candidate and any customer, supplier or competitor of our company; (viii) detailed information about any relationship or understanding between the proposing stockholder and the candidate; and (ix) a list of three character references, including complete contact information for such references. To give the Nominating and Governance Committee sufficient time to evaluate a recommended director candidate for the 20212023 Annual Meeting of Stockholders, the recommendation should be
16
received by our Secretary at our principal executive offices no later than December 3, 2020,January 20, 2023, which is the 120th calendar day before the first anniversary of the date our proxy statement was mailed to stockholders in connection with the Annual Meeting.
In addition, our bylaws permit stockholders to nominate directors for consideration at an annual meeting. For a description of the process for nominating directors in accordance with our bylaws, see “Stockholder Proposals for the 20212023 Annual Meeting of Stockholders” above.
Identification and Evaluation of Nominees for Director
The Nominating and Governance Committee uses a variety of methods for identifying and evaluating nominees for director. The Nominating and Governance Committee regularly assesses the appropriate size and composition of the Board, the needs of the Board and each committee of the Board, and the qualifications of candidates in light of these needs. Candidates may come to the attention of the Nominating and Governance Committee through stockholders, management, current members of the Board or search firms. The evaluation of these candidates may be based solely upon information provided to the Nominating and Governance Committee or may also include discussions with persons familiar with the candidate, an interview of the candidate or other actions the Nominating and Governance Committee deems appropriate, including the use of third parties to review candidates.
Code of Ethics
We have adopted a written Code of Ethics applicable to the Board and our officers and employees, including our principal executive officer, principal financial officer and principal accounting officer, in accordance with the rules of Nasdaq and the SEC. The Code of Ethics is available on our website at http://www.zovio.com under “Investors - Governance.”
Compensation Committee Interlocks and Insider Participation
During 2019,2021, no executive officer of our company (i) served as a member of the compensation committeeCompensation Committee (or other board committee performing equivalent functions or, in the absence of any such committee, the entire board of directors) of another entity, one of whose executive officers served on our Compensation Committee, (ii) served as a director of another entity, one of whose executive officers served on our Compensation Committee, or (iii) served as a member of the compensation committeeCompensation Committee (or other board committee performing equivalent functions or, in the absence of any such committee, the entire board of directors) of another entity, one of whose executive officers served as a director of our company.
Director Compensation
The following table presents compensation information for our non-employee directors for 2019. Mr. Clark’s compensation2021.
| Name | Fees Earned or Paid in Cash ($) | Stock Awards ($)(1) | Total ($) | ||||||||||||||||||||||||||||||||
| Teresa Carroll | 60,000 | 69,743 | 129,743 | ||||||||||||||||||||||||||||||||
| Michael Cole | 90,000 | 69,743 | 159,743 | ||||||||||||||||||||||||||||||||
| Ryan Craig | 95,000 | 69,743 | 164,743 | ||||||||||||||||||||||||||||||||
| Michael Horn | 55,000 | 69,743 | 124,743 | ||||||||||||||||||||||||||||||||
| Ron Huberman | 45,000 | 76,590 | 121,590 | ||||||||||||||||||||||||||||||||
| John Kiely | 90,500 | 69,743 | 160,243 | ||||||||||||||||||||||||||||||||
| Kirsten Marriner | 65,000 | 69,743 | 134,743 | ||||||||||||||||||||||||||||||||
| Victor Nichols | 102,500 | 69,743 | 172,243 | ||||||||||||||||||||||||||||||||
| George Pernsteiner | 126,875 | 140,704 | 267,579 | ||||||||||||||||||||||||||||||||
| John Wilson | 41,250 | 76,590 | 117,840 | ||||||||||||||||||||||||||||||||
(1) Represents the grant date fair value of the restricted stock unit award, computed in accordance with FASB ASC Topic 718. The valuation methodology used to calculate this amount is presenteddiscussed in Note 17, “Stock-Based Compensation,” to our annual consolidated financial statements for the Summary Compensation Table below andyear ended December 31, 2021, which are included in our Annual Report on Form 10-K for the related explanatory tables. Mr. Clark does not receive any additional compensation for his services as a director.
year ended December 31, 2021 filed with the SEC on April 15, 2022.
17
| Name | Fees Earned or Paid in Cash ($) | Stock Awards ($)(1) | Total ($) | ||||||||
| Teresa S. Carroll | 60,000 | 85,000 | 145,000 | ||||||||
| Michael P. Cole (2) | — | — | — | ||||||||
| Ryan D. Craig | 95,000 | 85,000 | 180,000 | ||||||||
| L. Dale Crandall (3) | 107,500 | 85,000 | 192,500 | ||||||||
| Robert Hartman | 27,083 | 85,000 | 112,083 | ||||||||
| Michael B. Horn | 55,000 | 85,000 | 140,000 | ||||||||
| John J. Kiely | 32,500 | 85,000 | 117,500 | ||||||||
| Kirsten M. Marriner | 57,500 | 85,000 | 142,500 | ||||||||
| Victor K. Nichols | 102,500 | 85,000 | 187,500 | ||||||||
| George P. Pernsteiner | 132,500 | 85,000 | 217,500 | ||||||||
The following table presents the total number of shares subject to either options outstanding orto unreleased RSUs as well as the number of shares subjector to vested exercisable options, for each non-employee director as of December 31, 2019.2021.
| Director | Total Number of Options Outstanding or Unreleased RSUs | Number of Vested Exercisable Options | ||||
| Teresa S. Carroll | 22,897 | — | ||||
| Michael P. Cole | — | — | ||||
| Ryan D. Craig | 54,924 | 41,214 | ||||
| L. Dale Crandall (1) | 54,924 | 41,214 | ||||
| Robert Hartman | — | — | ||||
| Michael B. Horn | 18,434 | — | ||||
| John J. Kiely | 35,420 | — | ||||
| Kirsten M. Marriner | 22,897 | — | ||||
| Victor K. Nichols | 41,744 | 28,034 | ||||
| George P. Pernsteiner | 18,434 | — | ||||
| Director | Number of Unreleased RSUs | Number of Vested Exercisable Options | |||||||||||||||
| Teresa Carroll | 19,472 | — | |||||||||||||||
| Michael Cole | 30,577 | — | |||||||||||||||
| Ryan Craig | 16,410 | 32,714 | |||||||||||||||
| Michael Horn | 16,410 | — | |||||||||||||||
| Ron Huberman | 31,370 | — | |||||||||||||||
| John Kiely | 34,120 | — | |||||||||||||||
| Kirsten Marriner | 19,472 | — | |||||||||||||||
| Victor Nichols | 16,410 | 28,034 | |||||||||||||||
| George Pernsteiner | 36,860 | — | |||||||||||||||
| John Wilson | 31,370 | — | |||||||||||||||
The following table presents our non-employee director compensation program. The Compensation Committee reviews director compensation annually, including fees, retainers and equity compensation, as well as total compensation, and makes recommendations to the Board regarding the compensation program. In 2019,2021, the Compensation Committee worked with Pearl Meyer & Partners,Pay Governance, LLC (“Pearl Meyer”Pay Governance”), compensation consultants, in determining appropriate changes to director compensation.
| Position | Annual Cash Retainer ($) | Annual Equity Award ($) | ||||||||||||||||||||||||
| Continuing Director | 50,000 | 85,000 | (3) | |||||||||||||||||||||||
| Board of Directors Chair | 50,000 | (1) | — | |||||||||||||||||||||||
| Audit Committee Chair | 15,000 | (2) | — | |||||||||||||||||||||||
| Compensation Committee Chair | 10,000 | (2) | — | |||||||||||||||||||||||
| Nominating and Governance Committee Chair | 5,000 | (2) | — | |||||||||||||||||||||||
| CEO Search Committee Chair | 3,000 | (2) | — | |||||||||||||||||||||||
| Audit Committee Member | 10,000 | — | ||||||||||||||||||||||||
| Compensation Committee Member | 7,500 | — | ||||||||||||||||||||||||
| Nominating and Governance Committee Member | 5,000 | — | ||||||||||||||||||||||||
| CEO Search Committee Member | 7,500 | — | ||||||||||||||||||||||||
| M&A Oversight Committee Member | 25,000 | — | ||||||||||||||||||||||||
(1) The annual cash retainer for serving as board chair is to be paid in addition to the annual cash retainer for board membership.
(2) The annual cash retainer for serving as committee chair is to be paid in addition to the annual cash retainer for committee membership.
(3) The annual equity award was comprised of restricted stock unit awards. The annual restricted stock units vest in full on the first anniversary of the date of grant, subject to the continuing service of the director. Upon initial election to the Board, directors receive an initial grant of $85,000 of restricted stock units that vest over four years on the anniversary date of the grant, subject to the continuing service of the director.
18
| Position | Annual Cash Retainer ($) | Annual Equity Award ($) | ||||||
| Continuing Director | 50,000 | 85,000 | (3) | |||||
| Board of Directors Chair | 50,000 | (1) | — | |||||
| Audit Committee Chair | 15,000 | (2) | — | |||||
| Compensation Committee Chair | 10,000 | (2) | — | |||||
| Nominating and Governance Committee Chair | 5,000 | (2) | — | |||||
| Audit Committee Member | 10,000 | — | ||||||
| Compensation Committee Member | 7,500 | — | ||||||
| Nominating and Governance Committee Member | 5,000 | — | ||||||
| M&A Oversight Committee Member | 25,000 | — | ||||||
| EXECUTIVE OFFICERS | ||||
Our executive officers are appointed by, and serve at the discretion of, the Board. Each executive officer is a full-time employee of Zovio. The names of our current executive officers, their ages as of December 31, 2019,2021, titles and biographies are set forth below:
| Name | Age | Position | ||||||||||||
| Kevin S. Royal | Executive Vice President/Chief Financial Officer | |||||||||||||
| Steven R. Burkholder | Vice President, Chief Accounting Officer and Corporate Controller | |||||||||||||
| Vickie L. Schray | Executive Vice President and Chief External Affairs Officer | |||||||||||||
| John W. Semel | Executive Vice President/Chief Strategy Officer | |||||||||||||
| Executive Vice | ||||||||||||||
Kevin S. Royal joined us in October 2015 and serves as our Executive Vice President/Chief Financial Officer. Mr. Royal resigned from his position infrom October 2017 to April 2018 for personal reasons unrelated to the Company, and resumed service in the same position in April 2018.Company. Prior to joining us, Mr. Royal was Senior Vice President, Chief Financial Officer, Treasurer and Secretary of Maxwell Technologies, Inc., a developer, manufacturer and marketer of energy storage and power delivery solutions from April 2009 to May 2015. From May 2005 until April 2009, Mr. Royal was Senior Vice President and Chief Financial Officer of Blue Coat Systems, Inc., a previously Nasdaq-listed developer and provider of application delivery network technology. From December 1996 until May 2005, Mr. Royal held a series of senior finance positions, culminating with his appointment as vice president and chief financial officer of Novellus Systems, Inc., an S&P 500 company that manufactures, markets and services semiconductor capital equipment. Before Mr. Royal joined Novellus, he spent 10 years with Ernst & Young LLP, where he became a certified public accountant. Mr. Royal received his Bachelor of Business Administration from Harding University.
Steven R. Burkholder has served as our Vice President, Chief Accounting Officer and Corporate Controller since June 1, 2017. Mr. Burkholder previously served as our Associate Vice President, Assistant Controller from September 2012. Prior to joining us, Mr. Burkholder served in various roles at PricewaterhouseCoopers LLP, a public accounting firm, from September 2001 to September 2012, culminating in his appointment as Senior Manager in June 2011. As Senior Manager, he led engagement teams including audit, information technology, valuation and tax professionals. Mr. Burkholder received his Bachelor of Science in Business Accounting with honors from the University of Minnesota - Carlson School of Management and his Masters in Business Administration from Ashford University, and is a certified public accountant.
Vickie L. Schray joined us in January 2011 and currently serves as our Executive Vice President, Chief External Affairs Officer. Prior to Ms. Schray’s current appointment in September 2018, Ms. Schray also served as Executive Vice President, Regulatory Affairs and Public Policy since October 2016, as well as our Senior Vice President, Regulatory Affairs and Public
Policy and also as our Vice President Regulatory Affairs. Ms. Schray has over 20 years of experience in postsecondary education and has worked at the federal, state and institutional level. From 1998 to 2010, Ms. Schray served in various leadership positions with the U.S. Department of Education, including Acting Deputy Assistant Secretary in the Office of Postsecondary Education, Senior Policy Analyst in the Office of the Under Secretary, and as the Deputy Director for the Secretary of Education’s Commission on the Future of Higher Education. Before her work with the Department of Education, Ms. Schray consulted for the National School-to-Work Opportunities Office and was Deputy Director of the National Skill Standards Board. Ms. Schray earned an M.S. at Portland State University and a B.S. at Oregon State University.
John W. Semel joined us in March 2019 and has served as our Executive Vice President, Chief Strategy Officer since that time. Mr. Semel was most recently interim Chief Strategy Officer of Mood Media, an international in-store customer engagement company, since 2018.from 2018 to 2019. At Mood Media, Mr. Semel drove strategic planning, strategic partnerships, and product development for
19
new revenue sources. Prior to joining Mood Media, Mr. Semel served as the Chief Strategy Officer of John Wiley and Sons, a global leader in research and education, focusing on publishing, platforms and services for researchers, learners, universities, and corporations, from 2009 to 2017. At John Wiley and Sons, Mr. Semel helped build Wiley Solutions, its online education business. Over his career, Mr. Semel has held senior strategy and principal investment roles at MTV Networks, The Hearst Corporation, Everger Investment Associates, and PRIMEDIA. Mr. Semel began his career at J.P. Morgan and Company as an analyst and then an associate in Equity Capital Markets and Syndicate before moving on to High Yield Capital Markets and Syndicate. Mr. Semel received his B.A. from Brown University and his M.B.S. from Harvard Business School.
None of our executive officers has any family relationships with any of our other executive officers or directors. There currently are no legal proceedings, and during the past ten years there have been no legal proceedings, that are material to the evaluation of the ability or integrity of any of our executive officers.
20
EXECUTIVE COMPENSATION
| COMPENSATION DISCUSSION AND ANALYSIS | ||
This section of the proxy statement explains how the Compensation Committee (“Compensation Committee”) of the Board of Directors oversees our executive compensation programs and discusses the compensation earned by Zovio’s named executive officers (“NEOs”), as presented in the tables below under “Executive Compensation.”
| Randy Hendricks | This Compensation Discussion and Analysis is composed of these sections: | |||||||
| Chief Executive Officer (“CEO”) | ||||||||
| 1. | Executive Summary | |||||||
| George Pernsteiner | 2. | Compensation Program Highlights | ||||||
| Chairman of the Board and Office of the CEO | 3. | Compensation Framework | ||||||
| 4. | Plan Design and Award Decisions | |||||||
| Christopher Spohn | 5. | Compensation Risk Management, Policies & Practices | ||||||
| Executive Vice President, Operations and Office of the CEO | ||||||||
| Andrew Clark | Detailed compensation tables that quantify and further explain our NEOs’ compensation follow this Compensation Discussion and Analysis. | |||||||
| Former President and Chief Executive Officer (“Former CEO”) | ||||||||
| Kevin Royal | ||||||||
| Executive Vice President, Chief Financial Officer (“CFO”) | ||||||||
| John Semel | ||||||||
| Executive Vice President, Chief Strategy Officer | ||||||||
| Diane Thompson | ||||||||
| Former Executive Vice President, General Counsel | ||||||||
| Marc Brown | ||||||||
| Former Chief Human Resource Officer (“Former CHRO”) | ||||||||
| Matthew Hillman | ||||||||
| SVP, University Partnerships | ||||||||
| Matt Mitchell | ||||||||
| SVP, Secretary and General Counsel | ||||||||
| EXECUTIVE SUMMARY | ||
Zovio is going through one of the most significant transformations in our company history. This Compensation Discussion & Analysis contains a retrospective review of our compensation practices up through December 31, 2021 under our previous business model and prospectively comments on highlights of our compensation plans for 2022 as we move forward.
In April 2019, we changed our name to Zovio Inc as part of our strategy to transform from providing postsecondary education through one institution to being an education technology services provider to many university partners. In 2019, we also acquired Fullstack Academy, Inc., an immersive coding boot camp, and TutorMe.com, Inc., a provider of instant online tutoring services.
In December 2020, the Company finalized a definitive Asset Purchase and Sale Agreement with the Arizona Board of Regents on behalf of the University of Arizona and the University of Arizona Global Campus (“Global Campus”), a newly formed Arizona nonprofit corporation. Global Campus now owns and operates Ashford University in affiliation with the University of
21
Arizona, focusing on expanding access to education for non-traditional adult learners. Zovio will provide services to Global Campus under a long-term Strategic Services Agreement.
In March 2021, the Company commenced a search for a new Chief Executive Officer (“CEO”) to lead its continuing transition in becoming an education technology services company. From March 2021 to December 2021, the Company was led by the Office of the CEO, comprised of George Pernsteiner, Chairman of the Board and Christopher Spohn, Executive Vice President of Operations, with Diane Thompson, Executive Vice President in an advisory capacity. Under the guidance of the Board, the Office of the CEO helped advance the Company’s strategic plan and ensure continued operations and provision of quality services. In December 2021, the Company hired its current CEO, Randy Hendricks.
| COMPENSATION PROGRAM HIGHLIGHTS | ||
The Compensation Committee is dedicated to maintaining a structured and balanced compensation program designed to attract, motivate and retain highly skilled and talented executives to redefine the education services industry and drive Company performance. Our compensation programs’ continued evolution is a testament to the Compensation Committee’s determination to align with market best practices, shareholders’ interests, and our business model’s ongoing transformation.
The chart below outlines key features of our executive compensation program:
| Compensation Program Highlights | |||||
| Incentive Plans | Our incentive plans are split between short-term incentives (“STI”) and long-term incentives (“LTI”) to balance short-term and long-term value creation. | ||||
| Equity Awards | We offer our executive officers a combination of performance stock units (“PSUs”) and time-based restricted stock units (“RSUs”) to align our executives’ interests with those of shareholders and reward the attainment of specific performance objectives. | ||||
| Vesting Periods | All performance-based equity vests on the third anniversary of the grant date. This vesting period was selected to align with the achievement of specific performance-based metrics. Our time-based equity awards vest annually in one-third increments over three years. | ||||
| Performance Measures | For executive officers, at least 60% of their LTI awards are performance-based and tied to performance metrics that support our strategic objectives that we believe will drive shareholder value over the long-term. | ||||
| Stock Ownership Guidelines | We require our CEO, Executive Vice Presidents and Senior Vice Presidents to maintain minimum stock ownership levels (6x, 3x and 2x of base salary, respectively). These requirements reinforce our belief in the importance of aligning our executives’ interests with the interests of our shareholders. | ||||
| Market-based Compensation | We regularly perform market-based compensation analysis to ensure that our executive officers’ total compensation packages remain competitive. | ||||
| Peer Group | We leverage a peer group that reflects the size, scope, and complexity of our transforming business to stay informed of market trends and understand how our compensation programs and practices compare to similar companies. | ||||
| Recoupment Policy | We have adopted a recoupment policy (clawback policy) that covers all performance-based compensation. | ||||
| COMPENSATION FRAMEWORK | ||
Compensation Philosophy and Design Principles
Our executive compensation programs support our philosophy of attracting, motivating, and retaining talented executives required to redefine a fragmented, highly competitive and continuously evolving education industry while delivering strong results and long-term shareholder value. We aim to provide externally competitive and internally equitable compensation programs that support our transformation and align with our pay-for-performance philosophy. Our compensation program is anchored in four design principles:
22
◦Attract, motivate, and retain executive talent required to redefine and create industry-leading products and services;
◦Establish a clear link between compensation outcomes and the achievement of our financial and operational objectives; and
◦Ensure fairness among our executives by recognizing each individual’s contributions, prior experience, and unique skills and abilities.
Key Program Design Components
Our balanced and structured compensation programs reflect the Compensation Committee’s belief that robust corporate governance is imperative for prudent compensation decision-making. Below are key elements of our compensation programs. We also identify certain pay practices that are not followed because we believe they do not serve our shareholders’ long-term interests.
| WHAT WE DO | WHAT WE DON’T DO | ||||
ü Adhere to a disciplined pay-for-performance philosophy that informs our compensation design and target pay levels ü Maintain an independent Compensation Committee that has oversight of executive pay design ü Utilize an independent compensation consultant who is hired by and reports directly to the Compensation Committee ü Require minimum levels of stock ownership for our executives and directors ü Maintain a formal clawback policy applicable to all performance-based compensation that covers both financial restatements and certain detrimental conduct ü Deploy a multi-year vesting approach on equity ü Conduct an annual compensation risk assessment ü Utilize a rigorous target-setting process for our incentive plan metrics ü Impose limits on maximum incentive payouts | û No guaranteed salary increases û No credit for unvested performance shares or vested stock options when determining compliance with stock ownership guidelines û No hedging or pledging of Zovio stock û No repricing underwater stock options û No excessive perquisites for senior leaders; all perquisites require specific business rationale û No perquisite-related tax gross-ups for executive officers (except for company-wide benefits such as relocation) û No special retirement plans exclusively for executive officers û No excise tax gross-ups related to change of control | ||||
Our strong governance practices extend beyond our executive compensation programs to compensation plans for all employees. For our company-wide compensation and human capital management practices, we focus on building an inclusive culture and advancing fair pay. Annually, we assess the gap in average pay between employees of different genders in the same or similar roles after accounting for legitimate business factors that can explain differences, such as performance, time in position, and tenure. Finally, we perform an annual review of our compensation programs to assess whether the programs’ provisions and operations create undesired or unintentional material risk.
Overview of Compensation Elements
The material components of our executive compensation program are base salary, short-term cash incentives, and long-term equity incentives. We believe that a combination of pay elements competitive with the market, emphasizing incentive-driven pay coupled with goals appropriately aligned with the business strategy, provides strong incentives to our NEOs to take actions that result in positive outcomes for our Company and shareholders.
23
| Pay Element | Purpose | Performance Period | Performance Metric | ||||||||
| Base Salary | Market competitive fixed compensation reflecting executive’s scope of responsibility | Annual | — | ||||||||
| Short-Term Cash Incentive | Cash-based incentive compensation to reward achievement of Zovio’s short-term financial and operational objectives | One-Year Period | ◦Revenue ◦Net Income ◦EBITDA ◦Operational Goals | ||||||||
| Restricted Stock Units | Facilitates stock ownership, executive retention, and shareholder alignment | Three-Year Period with Annual Vesting | ◦Value of RSUs is tied to our stock price | ||||||||
| Performance Stock Units | Reward long-term profitability, long-term performance, and alignment with shareholders | Three-Year Performance Period | ◦EBITDA ◦rTSR (relative total shareholder return) | ||||||||
CEO and NEO Pay Mix
In 2021, the majority of our executive compensation consisted of variable, at-risk compensation for the NEOs. As illustrated below, 58% of NEO compensation was at-risk pay, and 29% of the NEO’s overall compensation was delivered in equity with multi-year vesting. The CEO pay opportunity reflects the overall compensation for our new CEO. As described under the 2021 Long-Term Incentive (LTI) Plan, the Compensation Committee, the equity value for 2021 was granted using a higher stock price than the stock price on the date of grant to convert the award into shares. Equity value was converted using the 20-day trading average stock price prior to the date of grant which resulted in 16% reduction in the grant value.
2021 CEO Pay Opportunity (1)(2) | 2021 NEOs Pay Opportunity (1)(2)(3) | ||||
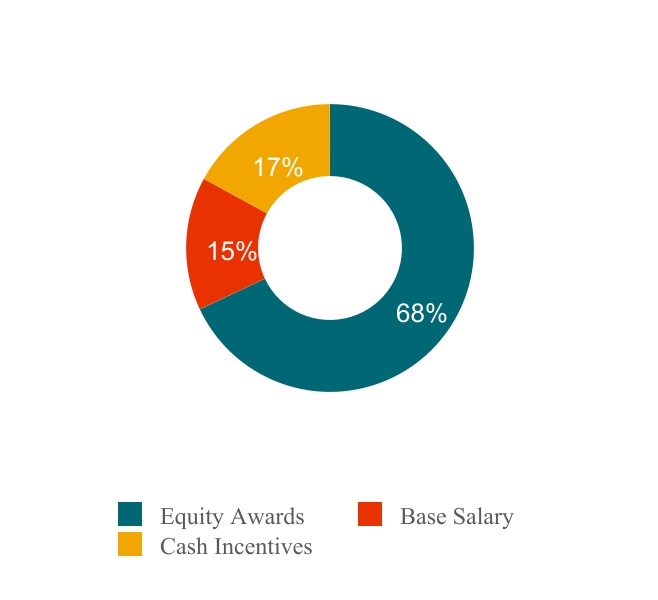
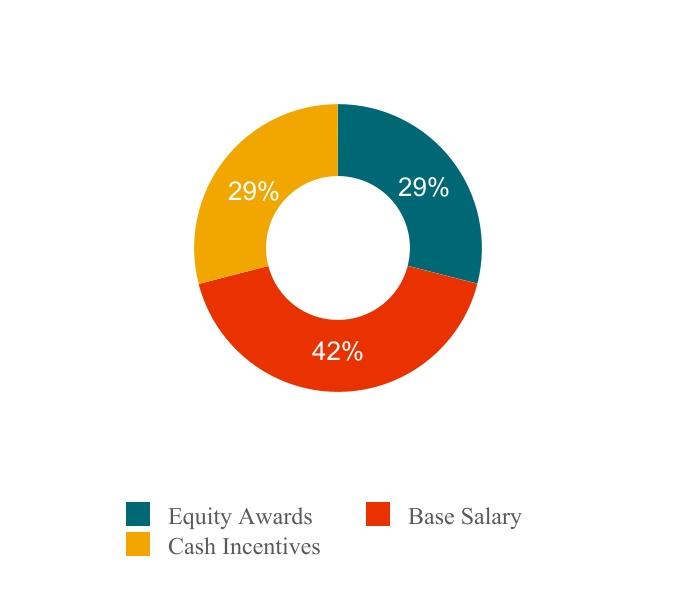
(1) Does not include Non-Qualified Deferred Compensation Earnings or All Other Compensation as reported in the 2021 Summary Compensation Table.
(2) Calculation reflects the accounting value of the equity awards. See details on 2021 equity awards under Long-Term Incentives.
(3) The average across the NEOs excluding the CEO.
24
Total Realized Compensation
When evaluating our executive compensation program, the Compensation Committee compares NEO target total compensation for a year with realizable pay, as illustrated by the Total Realized Compensation figures below.
| CEO | Other NEOs (Average) | ||||||||||||||||
| Target | ___________________ | 100% | Target | ___________________ | 100% | ||||||||||||
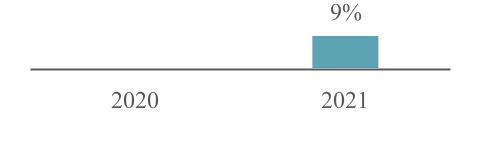
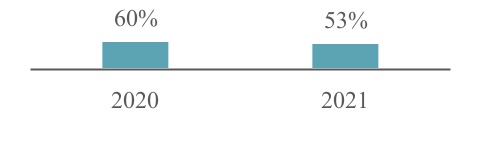
For 2021, our CEO realized total compensation equal to 9% of his 2021 target compensation level, while total realized compensation for our NEOs ranged from 47% to 58%. This is driven by the zero dollar bonus payout for 2021 performance and the realized value from LTI vestings in 2021. This outcome demonstrates our ongoing commitment to compensating our leadership based on the Company’s performance and placing a significant portion of executive compensation “at risk.”
| 2021 Pay Opportunity Comparison to Total Realized Compensation | ||||||||||||||
| Named Executive Officer | 2021 Pay Opportunity | 2021 Total Realized Compensation | % of Pay Opportunity Realized | |||||||||||
| Randy Hendricks | $3,699,741 | $331,731 | ò | 9% | ||||||||||
| Christopher Spohn | $1,878,590 | $883,236 | ò | 47% | ||||||||||
| Kevin Royal | $1,003,126 | $585,721 | ò | 58% | ||||||||||
| John Semel | $1,097,663 | $595,230 | ò | 54% | ||||||||||
| Matthew Hillman | $706,163 | $352,640 | ò | 50% | ||||||||||
| Matt Mitchell | $612,283 | $345,506 | ò | 56% | ||||||||||
Pay Opportunity is calculated as follows:
| Base Salary | + | Target Bonus Opportunity | + | Grant date fair value of equity awards | ||||||||||
Total Realized Compensation is calculated as follows:
| Base Salary | + | Actual Bonus Earned | + | Value realized from shares vested during the year | ||||||||||
Our executive compensation philosophy and practices reflect our strong commitment to pay for performance—both short-term and long-term. We design our executive compensation program to attract and retain top management talent, reward financial and operational performance and recognize effective strategic leadership, key elements of driving shareholder value and sustainable growth. Zovio’s Chief Executive Officer’s compensation is anchored in our compensation philosophy and design principles, providing a well-balanced total rewards package that encourages decisions and behaviors that aligns executives’ interests with shareholders’ interests.
25
Inputs into Compensation Decisions
For 2021, the Compensation Committee received input from several sources and reference points to guide its design of the Company’s executive compensation programs and individual pay decisions. The Compensation Committee views this multi-perspective approach critical as it evaluates peer companies’ practices, investor viewpoints, changes in external market practices and input into each executive’s evolving role and performance.
The Compensation Committee regularly reviews input and data provided by its independent compensation consultant, our shareholders, external market practice surveys, and individual performance to make informed compensation decisions. Also, the Compensation Committee reviews tally sheets that provide a comprehensive look at total compensation for each NEO. The chart below further describes the process:
| Independent Compensation Consultant / Market Data | Shareholder Say-on- Pay | Peer Group | Management | ||||||||
–Evaluates comparative market data against peer group and survey data –Advises the Compensation Committee on compensation plan design, targets and pay mix –Provides the Compensation Committee with research on trends and best practices | –Engage with shareholders to understand their viewpoints and focus –Results of the advisory Say-on-Pay vote | –Our peer group is reviewed annually and comprised of companies that are of similar revenue, market capitalization, and complexity where we may recruit talent –Provides a reference point to inform executive compensation decisions | –CEO provides input regarding the various roles and responsibilities of his direct reports and their overall performance –CEO provides recommendations to the Compensation Committee for the compensation of his direct reports and the rationale for those decisions | ||||||||
Independent Compensation Consultant
For 2021, the independent compensation consultants for the Committee were Pay Governance. The compensation consultant reports directly to the Compensation Committee and interacts with Zovio management when necessary and appropriate. For all regularly scheduled Compensation Committee meetings, a representative from Pay Governance attended at the invitation of the Compensation Committee.
In accordance with the Compensation Committee’s Charter, the Compensation Committee has the sole authority to retain and terminate any compensation consultant to be used to assist it in the evaluation of CEO, executive officer, and non-employee director compensation. Compensation consultants provide services to the Compensation Committee as an independent consultant and do not have any other consulting engagements or provide any other services to Zovio. The independence of the compensation consultants has been assessed according to factors stipulated by the SEC. The Compensation Committee concluded that no conflict of interest exists that would prevent them from independently advising the Compensation Committee.
While the Compensation Committee considers its compensation consultant’s recommendations in making decisions regarding executive compensation, the Compensation Committee is not obligated to follow its compensation consultant’s advice. It may instead determine to pay amounts and/or forms of compensation other than as recommended by its compensation consultant. The Compensation Committee intends to review its relationship with its compensation consultant periodically.
Peer Group
The Compensation Committee reviews our peer group and comparative market data annually to help determine our NEOs and other executive officers’ compensation. These references help determine base salary ranges, short-term incentive and long-term incentive awards, and the overall competitiveness of the total compensation package.
26
In collaboration with its independent compensation consultant, the Compensation Committee uses the framework below to select a broad group of potential peers. This framework yields multiple perspectives that enrich our understanding of competitive pay practices while also ensuring that our peer group is comprised of companies with whom we may compete for talent, whose revenues and market capitalization and business focus are similar to our own. We believe it is vital to maintain peer-group stability, limiting changes only when warranted and improving market comparability or better aligning with selection criteria.
| Industry | Strategic Focus | Talent | Size / Growth | Customers | ||||||||||
| Operates in a similar education or technology sector | Similar interests in education or technology | Compete for executive talent and experience | Similar revenue and market capitalization | Similar types of customers and/or product offerings | ||||||||||
The peer group that was used to inform our 2021 pay decisions was:
| Benefitfocus, Inc. | K12 Inc. | Synacor, Inc. | ||||||
| Ebix, Inc. | Perdoceo Education Corporation | Syncronoss Technologies, Inc. | ||||||
| GreenSky, Inc. | QAD Inc. | Telenav, Inc. | ||||||
| Houghton Mifflin Harcourt Comp | RealNetworks, Inc. | 2U, Inc. | ||||||
| i3 Verticals, Inc. | Rimini Street, Inc. | Universal Technical Institute, Inc. | ||||||
In August 2021 and November 2021, Pay Governance reviewed market data from the peer group and data from national compensation surveys, providing a written report summarizing its findings to the Compensation Committee regarding executive and board compensation considerations for the Company’s transition to an education technology services company. This data was not used to make any pay changes to base salary, annual incentive targets or long-term incentive targets in 2021, but may be used going forward as we transition to an education technology services company.
In late 2021, the Compensation Committee worked with Pay Governance to modify the peer group to account for mergers and acquisitions or other significant changes in the companies and that better reflected the company’s business model, revenues, market capitalization, revenue growth and EBITDA margins. This peer group, which was used for 2022 compensation decisions, consists of the following companies:
| ALJ Regional Holdings, Inc. | Kaspien Holdings Inc. | RealNetworks, Inc. | ||||||
| Aspen Group, Inc. | Limelight Networks, Inc. | Rimini Street, Inc. | ||||||
| Benefitfocus, Inc. | Lincoln Educational Services Corp. | Stride, Inc. | ||||||
| Ebix, Inc. | Net Element, Inc. | Synchronoss Technologies, Inc. | ||||||
| GreenSky, Inc. | Perdoceo Education Corporation | 2U, Inc. | ||||||
| Houghton Mifflin Harcourt Comp | QAD Inc. | Universal Technical Institute, Inc. | ||||||
| i3 Verticals, Inc. | ||||||||
27
| PLAN DESIGN AND AWARD DECISIONS | ||
2021 Base Salaries
On an annual basis, the Compensation Committee, in consultation with its independent compensation consultant, reviews the market data and current base salaries for our executive officers, considering adjustments where deemed appropriate. Salary increases, if any, must receive advance approval from the Compensation Committee.
The table below presents the base salaries for 2020 and 2021:
| Named Executive Officer | Position | 2020 Base Salary | 2021 Base Salary | % Change 2021 vs. 2020 | ||||||||||
| Randy Hendricks | CEO | N/A | $550,000 | N/A | ||||||||||
| George Pernsteiner | Chairman of the Board and Office of the CEO | N/A | N/A | N/A | ||||||||||
| Christopher Spohn | EVP, Operations and Office of the CEO | $525,000 | $525,000 | —% | ||||||||||
| Andrew Clark | Former President and CEO | $777,000 | $777,000 | —% | ||||||||||
| Kevin Royal | EVP, Chief Financial Officer | $395,000 | $395,000 | —% | ||||||||||
| John Semel | EVP, Chief Strategy Officer | $500,000 | $500,000 | —% | ||||||||||
| Diane Thompson | Former EVP, General Counsel | $422,300 | $422,300 | —% | ||||||||||
| Marc Brown | Former Chief Human Resource Officer | $312,000 | $325,000 | 4% | ||||||||||
| Matthew Hillman | SVP, University Partnerships | $350,000 | $350,000 | —% | ||||||||||
| Matt Mitchell | SVP, Secretary and General Counsel | $288,000 | $300,000 | 4% | ||||||||||
2021 Short-Term Incentive Plan
In May 2021, the Compensation Committee adopted the 2021 Short Term Incentive (“STI”) Plan in consultation with its independent compensation consultant. The 2021 STI Plan was designed to ensure alignment with our strategy and external market practices, and to maintain an appropriate balance of risk and reward to motivate, retain, and engage our executive officers. The evaluation included considerations of the following elements:
◦Align with creating near-term shareholder value and consistent use of metrics;
◦Balance financial targets with operational goals that are leading indicators of high performance;
◦Adopt practices used by top-performing companies in our peer group; and
◦Establish targets that demonstrate year-over-year improvement with over-performance resulting in additional payout opportunity.
28
Under the 2021 STI Plan, the payment of annual performance-based cash bonuses to our NEOs and other executive officers was based on the achievement of key financial and operational objectives:
| For this purpose, Non-GAAP Net Income is defined as net income plus other income (expense), including interest, income tax benefit, depreciation, and amortization plus certain other expenses as more fully described below. | ||
| For the Revenue metric, a payout is earned between the target and maximum based on the attainment of performance goals. Similarly, reduced payouts are earned between the minimum threshold and target based on the achievement of performance goals. | ||
| For Non-GAAP Net Income metric, a payout is earned for every dollar in positive net income growth above threshold. | ||
| A threshold of positive EBITDA performance exists in order for the plan to fund any of the two metrics. In addition, Operational Goals in Student Net Promoter Score ("NPS"), Employee Engagement, New University Clients, and Client Satisfaction were included, requiring 2 of the 4 metrics to be met in order to fund the plan. | ||
2021 Short-Term Incentive (STI) Plan Results
| Annual STI Payout Percentage | ||||||||||||||
| Named Executive Officers | Below Threshold | Threshold | Target | Maximum | ||||||||||
| 0% | 50% | 100% | 200% | |||||||||||
Award payouts were calculated using the following formula:
| Base Salary for Year | x | Target Annual STI Percentage | x | Performance Attainment (0% - 200%) | = | Annual STI Payout | ||||||||||||||
For 2021, based on our performance, the Compensation Committee approved a payout of 0.0% of target for the NEOs and other executive officers as follows:
Performance Targets (in millions) | Weighting | Threshold (50%) | Target (100%) | Maximum (200%) | Performance Attainment | Total Payout1 | ||||||||||||||
| Revenue | 10% | $247.5 | $275.0 | $302.5 | $263.0 | 8.0% | ||||||||||||||
| Non-GAAP Net Income | 90% | $(6.7) | $(5.6) | $(4.4) | $(15.7) | 0.0% | ||||||||||||||
| EBITDA | Gateopener | n/a | $(9.7) | n/a | ||||||||||||||||
| Operational Metrics | Gateopener | n/a | Met 3 of 4 | n/a | ||||||||||||||||
| Total | 0.0% | |||||||||||||||||||
(1) Revenue performance exceeded threshold and would have resulted in a payout of 8%, however EBITDA was negative which negates any funding that may have been earned on either metric.
Interpolation is used to determine the payout percentages that fall between threshold and target and between target and maximum.
The Operational Metrics for 2021 included average Student NPS, Employee Engagement, the number of New University Clients, and Client Satisfaction. The student NPS of 58.5 exceeded the goal of 51.8 and slightly exceeded the maximum performance target of 58.0, a strong indicator that the Company positively impacted students’ perception of their academic
29
experience. The company added two new university clients in 2021, meeting goal and deployed a new client satisfaction survey in December, meeting the goal of developing and deploying a new survey.
| Named Executive Officer | 2021 Base Pay | 2021 STI Target | Payout | Actual Payout | ||||||||||
| Randy Hendricks | $550,000 | 115% | —% | $— | ||||||||||
| George Pernsteiner | N/A | N/A | $— | |||||||||||
| Christopher Spohn | $525,000 | 115% | $— | |||||||||||
| Andrew Clark | $777,000 | 100% | $— | |||||||||||
| Kevin Royal | $395,000 | 55% | $— | |||||||||||
John Semel 1 | $500,000 | 75% | $187,500 | |||||||||||
| Diane Thompson | $422,300 | 50% | $— | |||||||||||
| Marc Brown | $325,000 | 55% | $— | |||||||||||
| Matthew Hillman | $350,000 | 65% | $— | |||||||||||
| Matt Mitchell | $300,000 | 50% | $— | |||||||||||
(1)Mr. Semel received a guaranteed bonus payout as part of a contractual obligation
Any amount of performance-based cash bonus that each NEO earned is shown in the “Non-Equity Incentive Plan Compensation” column of the Summary Compensation Table later in the proxy statement.
2021 Long-Term Incentive (LTI) Plan
Long-term incentives provide a critical link between long-term shareholder value and the financial rewards provided to our executive officers. In May 2021, the Compensation Committee approved the following mix of long-term incentive awards for our NEOs and other executive officers.
The Compensation Committee approved an award of RSUs and PSUs to our NEOs and other executive officers under the 2009 Stock Plan. The percentage of performance shares was 60% in 2021.
| The RSUs vest annually over three years and align the executive officers’ interests with shareholders by emphasizing long-term value creation and retaining top talent through our transition to an education technology services provider. | ||
| At the end of the three years, the PSUs vest, based on EBITDA performance vs. a three-year cumulative goal. The number of shares vesting at the end of the performance can further be modified based upon the attainment of a rTSR (relative total shareholder return) performance against the Russell 200 index.. | ||
| Given the volatility in our stock price during 2021, the Compensation Committee determined to use a premium stock price when converting target LTI values into a number of RSUs and PSUs granted. The premium value applied to the annual grant for executives and was 220% of the FMV of the stock on grant date. | ||
The Compensation Committee believes that the combination of RSUs and PSUs in 2021, with the majority being performance shares, is consistent with best practices and the feedback we received during our shareholder outreach, aligning our executives and shareholders’ interests.
30
The Compensation Committee, in consultation with its independent compensation consultant, determined the 2021 aggregate amounts and terms of equity compensation awards for each NEO and executive officer. The Compensation Committee reviewed the equity programs, peer companies’ practices, and the outstanding equity information for each executive officer.
The 2021 approved equity awards for the NEOs are:
| Named Executive Officer | PSUs 60% | RSUs 40% | Total 2021 LTI Award | Total 2020 LTI Award | % Change 2021 vs. 2020 | ||||||||||||
| Randy Hendricks | $1,518,000 | $838,241 | $2,356,241 | $— | N/A | ||||||||||||
| George Pernsteiner | $— | $185,000 | $185,000 | $85,000 | 118% | ||||||||||||
| Christopher Spohn | $866,250 | $627,500 | $1,493,750 | $1,643,750 | (9)% | ||||||||||||
| Kevin Royal | $474,000 | $316,000 | $790,000 | $790,000 | —% | ||||||||||||
| John Semel | $270,000 | $180,000 | $450,000 | $450,000 | —% | ||||||||||||
| Diane Thompson | $225,508 | $200,339 | $425,847 | $375,847 | 13% | ||||||||||||
| Marc Brown | $210,600 | $140,400 | $351,000 | $336,960 | 4% | ||||||||||||
| Matthew Hillman | $156,000 | $104,000 | $260,000 | $65,000 | 300% | ||||||||||||
| Matt Mitchell | $144,000 | $96,000 | $240,000 | $167,272 | 43% | ||||||||||||
The number of shares underlying the RSUs and PSUs, as well as the vesting and other terms of the equity awards, are summarized under “Outstanding Equity Awards at Fiscal Year End” below.
2021 Long-Term Incentive (LTI) Plan Results
PSUs granted in 2021 had a three-year performance period. For 2021, PSU awards are modified by a three-year Russell 2000 relative TSR metric to determine the total PSU payout at the time of vesting (no upward adjustment if Zovio outperforms the Russell 2000 relative TSR but absolute TSR is negative). This award will vest based on for the cumulative performance from 2021 through 2023.
Other Benefits and Perquisites
We operate in a highly competitive, complex and consolidating industry and offer certain benefits that we believe are critical to attract and retain talent. These benefits, which are generally offered to all eligible employees, include medical, dental and life insurance benefits, short-term disability pay, long-term disability insurance and flexible spending accounts for medical expense reimbursements. We also have a Senior Management Benefit Plan (the “Benefit Plan”) in which our NEOs and other executive officers are eligible to participate. The Benefit Plan is a fully insured plan and provides an annual benefit of up to $100,000 per participant (including the participant’s eligible dependents) for unreimbursed medical expenses during a calendar year that are not covered by our major medical plan. Additionally, the Benefit Plan provides worldwide medical assistance services, including locating the nearest medical facility, finding an attorney and making arrangements for emergency medical evacuation.
We also offer our employees, including our NEOs, a 401(k)-retirement savings plan (the “401(k) Plan”). The 401(k) Plan is a defined contribution plan established in accordance with Section 401(a) of the Code. Employees may make contributions (pre-tax or after-tax) into the 401(k) Plan up to annual limits prescribed by the Internal Revenue Service. We also make matching contributions under the 401(k) Plan up to certain limits, including for our NEOs who participate in the 401(k) Plan.
Our NEOs and other executive officers were also eligible to participate in the Zovio Non-Qualified Deferred Compensation Plan (the “Deferred Compensation Plan”), pursuant to which certain of our highly compensated employees were permitted to defer up to 80% of their annual base salary and up to 100% of their annual performance bonus and any performance-based compensation into such plan. We do not make any contributions to the Deferred Compensation Plan on behalf of any participant, including any NEO, other than to contribute the matching contributions we would have made to the 401(k) Plan on such participant’s behalf in the event the participant’s contributions to the 401(k) Plan are required to be reduced pursuant to applicable 401(k) Plan contribution limitations. To the extent our NEOs elected to participate in the Deferred Compensation Plan, they may have elected to receive distributions while they are still working for us or they may have elected to receive distributions (i) at termination of employment or retirement, (ii) in the event of disability, death or financial hardship, or (iii) in the event we undergo a change of control. Investment gains or losses credited to a participant’s account in the Deferred Compensation Plan are based on investment elections made by the participant from prescribed mutual fund investment options. Each participant in the Deferred Compensation Plan made his or her own individual investment elections and could change any such investment election at any time.
31
The Zovio Non-Qualified Deferred Compensation Plan was eliminated effective December 31, 2021 and distributions will occur for participants in January 2023.
Change of Control Arrangements
The Compensation Committee provides change of control benefits to our NEOs because it recognizes that, as is the case with many publicly held corporations, the possibility of a change of control exists and the uncertainty and questions that a potential change of control may raise could result in the departure or distraction of our executives to the detriment of the Company and our shareholders. The details of the potential payments and benefits to be received by our NEOs upon the consummation of a change of control are discussed under “Potential Payments upon Termination and Change of Control” below.
Our current severance benefits in connection with a change in control are “double-trigger” benefits, that is they require both a change in control and termination of employment within a limited period of time after the change of control. The only exception is the immediate vesting of company matching contributions under our Deferred Compensation Plan.
The Compensation Committee believes change of control benefits are appropriate because (i) it helps retain key employees during change of control discussions, especially senior executive officers for whom long-term incentive plan awards represent a significant portion of their total compensation package, (ii) it is difficult to replicate underlying performance goals, where applicable to long-term incentive plan awards, after a change of control, and (iii) the possibility that the Company that made the original long-term incentive plan award will no longer exist after a change of control (and employees should not necessarily be required to have the fate of their outstanding long-term incentive plan awards tied to the new Company’s future success). Additionally, the “double trigger” treatment is appropriate because it prevents an unintended windfall to the executives in the event of a friendly change of control while still providing them with appropriate incentives to cooperate in negotiating any change of control in which they believe they may lose their employment.
The Deferred Compensation Plan provides that the matching contributions that we make to that Plan will fully vest upon the consummation of a change of control.
Our Executive Severance Plan and the related Severance Agreements provide Messrs. Hendricks, Royal and Semel with certain benefits and payments if the executives are terminated without cause or terminate employment for good reason. The Executive Severance Plan and the related Severance Agreements provide Messrs. Hendricks, Royal and Semel with some additional benefits if they incur a termination without cause or termination for good reason during the 24-month period following the consummation of a change of control. The benefits and payments that could be made to the executives under the Executive Severance Plan and the Severance Agreement are described under “Potential Payments upon Termination and Change of Control” below.
The 2009 Plan also provides that, unless otherwise provided in an award agreement: (i) upon a change of control where outstanding awards are assumed or continued, no accelerated vesting shall occur; and (ii) upon a change of control where outstanding awards are not assumed or continued, all awards shall vest and become exercisable immediately before such change of control. In this regard, the MSUs that were granted to Messrs. Clark, Royal and Semel, and Ms. Thompson in March 2019 provide the treatment upon a change of control that if the price of one share as reflected in a corporate transaction equals or exceeds 200% of the base stock price, the Compensation Committee shall take all action necessary to provide for the immediate vesting of all of the MSUs subject to such award.
Mr. Clark’s employment agreement provided that upon a change of control, 50% of each of Mr. Clark’s unvested equity awards that vest based solely on the passage of time would have vested upon the change of control. In addition, the employment agreement provided that if Mr. Clark incurred a termination without cause or a termination for good reason during the 24 months following the consummation of a change of control, he would have been entitled to the additional severance benefits, including cash severance, discussed below under “Potential Payments upon Termination and Change of Control” below.
32
Termination of Employment
The Compensation Committee believes that reasonable severance benefits for our NEOs are necessary to attract and retain qualified executives and limit the ability of our competitors to hire away our best talent. These benefits are also important because it may be difficult for such executives to find comparable employment within a short period of time following certain qualifying terminations. For Mr. Spohn, severance benefits are set forth in his employment agreement; for Messrs. Hendricks, Royal and Semel these benefits are set forth in our Executive Severance Plan and the Severance Agreements executed by Messrs. Hendricks, Royal and Semel. The payments and benefits to be received by our NEOs in the event of a termination without cause, resignation for good reason, termination for death or termination for disability are discussed under “Potential Payments upon Termination and Change of Control” below. Our NEOs may be eligible for additional severance benefits if there is a termination of employment or resignation for good reason within two years following the consummation of a change of control, as discussed under “Change of Control Arrangements” above.
On March 21, 2021, the Company and Mr. Clark entered into the Separation Agreement pursuant to which Mr. Clark would separate from service with the Company, resigning as Chief Executive Officer and all other offices of the Company, effective as of March 31, 2021. Mr. Clark’s separation from service with the Company is considered to be “without cause” as that term is defined in his employment agreement. Mr. Clark’s separation was not made in connection with a disagreement between Mr. Clark and the Company on any matter relating to the Company’s operations, policies or practices. Pursuant to the terms of his employment agreement, Mr. Clark is eligible to receive certain severance payments and benefits as described in his Employment Agreement, contingent upon his release of claims against the Company. In addition, the Separation Agreement provides that, in consideration of, among other things, Mr. Clark’s entry into certain restrictive covenants regarding non-competition and non-solicitation and agreement to provide support and cooperation with certain matters, Mr. Clark vested in certain equity awards based on the effective date of his separation and received an extension of the exercise period of his option awards from one year to three years and reimbursement of certain legal expenses in connection with the Separation Agreement.
| COMPENSATION RISK MANAGEMENT, POLICIES, AND PRACTICES | ||
Policy Regarding Deductibility of Compensation
On December 22, 2017, the Tax Cuts and Jobs Act (the “Act”) was signed into law, which significantly changed the executive compensation deduction rules in Section 162(m) of the Internal Revenue Code of 1986, as amended (the “Code”).
Prior to the Act, Section 162(m) of the Code limited the amount of compensation the Company could deduct in any one year for federal income tax purposes to $1 million for compensation paid to certain officers, unless the compensation qualified as “performance-based compensation” for purposes of Section 162(m). The Act repeals the “performance-based compensation” exception and, as a result, starting with tax years beginning after December 31, 2017, compensation paid to any individual serving as a named executive officer at any time during the year in excess of $1 million will not be deductible unless it qualifies for the Act’s transition relief applicable to binding written agreements that were in effect on November 2, 2017 and not materially modified thereafter.
The Compensation Committee will continue to monitor the impact that the Act will have on the Company’s compensation programs and contracts. However, the Compensation Committee continues to believe that, in certain circumstances, factors other than tax deductibility take precedence when determining the forms and levels of executive compensation most appropriate and in the best interests of our Company and our stockholders. Given the difficult regulatory and legislative environment we face and the competitive market for outstanding executive talent, the Compensation Committee believes it is important to retain the flexibility to design compensation programs consistent with its overall executive compensation philosophy even if some executive compensation is not fully tax deductible to us. Accordingly, the Compensation Committee may from time to time deem it appropriate to approve elements of compensation for certain executive officers that are not fully tax deductible which might include the approval of amendments to agreements that were initially intended to qualify as “performance-based compensation” if the Compensation Committee determines such amendments are in the best interests of our Company and our stockholders.
Recoupment Policy
The Company has a Recoupment Policy that provides for the clawback or cancellation of performance-based compensation from any NEO or executive officer in the following two situations:
◦Misconduct
◦Financial Restatements Outside of Misconduct
33
The table outlines our policies:
| Misconduct | Financial Restatements Outside of Misconduct | |||||||
| WHO | ◦NEOs and other executive officers | ◦NEOs and other executive officers | ||||||
| WHEN | ◦Intentional misconduct, gross negligence or failure to report intentional misconduct or gross negligence ◦Contributing factor in having to restate our financial statements ◦Fraud, bribery or any other illegal act | ◦Restatement of any of our financial statements (excluding changes due to account principles) ◦Restated financial results would have resulted in a lesser amount of paid performance-based compensation | ||||||
| WHAT | ◦Company may seek to recover incentive compensation ◦Cancel outstanding equity awards ◦Reimbursement of realized equity gains ◦Possible adjustment of future compensation ◦Disciplinary actions, up to and including termination | |||||||
We believe the Recoupment Policy is appropriate given the types and amounts of performance-based compensation we pay our NEOs and other executive officers, and that our policy incentivizes them to only take those risks that they determine are calculated to reward our shareholders without material adverse risk to our Company.
Stock Ownership Guidelines
We maintain the following robust stock ownership guidelines for our executive officers, including the NEOs. These guidelines are designed to further link these executives’ interests with the interests of shareholders:
| Chief Executive Officer | 6x Annual Base Salary | ||||||||||||||||||||||||||||||||||||||||
| Executive Vice Presidents | 3x Annual Base Salary | ||||||||||||||||||||||||||||||||||||||||
| Senior Vice Presidents | 2x Annual Base Salary | ||||||||||||||||||||||||||||||||||||||||
| Non-Employee Directors | 3x Annual Cash Retainer | ||||||||||||||||||||||||||||||||||||||||
The covered executives and directors may not sell shares of our common stock unless they satisfy the applicable ownership guidelines following the sale.
The Company does not consider the value of vested stock options, or unvested MSUs or PSUs in determining whether the required level of equity ownership meets the guidelines.
Trading in Company Securities
We have a policy that prohibits directors, executive officers, and employees from:
◦Using financial instruments (including prepaid variable forward contracts, equity swaps, collars, and exchange funds) that are designed to hedge or offset any decreases in the market value of our securities;
◦Holding our securities in margin accounts or pledging our securities as collateral for a loan; and
◦Executing short sales of our securities and derivative or speculative transactions in our securities.
34
Process for Granting Equity Awards
We do not grant any equity compensation, in anticipation of the release of material non-public information. Similarly, we do not time the release of material non-public information based on equity award grant dates. Any options granted to our NEOs and other executive officers are granted with an exercise price equal to or above the fair market value of the underlying stock on the date of grant.
Any equity awards approved by the Compensation Committee are granted as of the date of a quarterly meeting, unless a future effective date of grant is specifically authorized. Typically, equity awards are granted by the Compensation Committee pursuant to either a live or telephonic meeting. However, the Compensation Committee may also authorize the grant of equity awards pursuant to a unanimous written consent. If equity awards are authorized by unanimous written consent, the effective date of the grant is the date on which our Secretary has received all signatures to the unanimous written consent, unless a future effective date of grant is specifically authorized.
Tax and Accounting Considerations
While the Compensation Committee generally considered the financial accounting and tax implications of its executive compensation decisions, neither element was a material consideration in the compensation awarded to our NEOs and other executive officers during 2021.
35
| COMPENSATION COMMITTEE REPORT | ||
The Compensation Committee, which is composed solely of independent directors of the Board of Directors, assists the Board in fulfilling its responsibilities regarding compensation matters, and is responsible under its charter for determining the compensation of Zovio’s executive officers. The Committee has reviewed and discussed with management the Compensation Discussion and Analysis required by Item 402(b) of Regulation S-K. Based on this review and discussion, the Committee recommended to the Board of Directors that the section entitled “Compensation Discussion and Analysis” be included in this proxy statement.
Compensation Committee:
Michael Cole
Kirsten Marriner
Victor Nichols (Chair)
George Pernsteiner
April 15, 2022
36
| SUMMARY COMPENSATION TABLE | ||
The following table summarizes the total compensation earned by each of our named executive officers (“NEOs”) for 2021, 2020 and 2019.
| Name and Principal Position | Year | Salary ($) | Bonus ($) | Stock Awards ($)(1) | Option Awards ($)(2) | Non-Equity Incentive Plan Compensation ($)(3) | Changes in Pension Value and Nonqualified Deferred Compensation Earnings ($)(4) | All Other Compensation ($)(5)(6) | Total ($) | ||||||||||||||||||||||||||||||||||||||||||||
| Randy Hendricks | 2021 | 31,731 | 300,000 | 2,517,241 | — | — | — | 1,957 | 2,850,929 | ||||||||||||||||||||||||||||||||||||||||||||
| Chief Executive Officer | — | ||||||||||||||||||||||||||||||||||||||||||||||||||||
| George Pernsteiner | 2021 | 392,829 | 100,000 | 140,705 | — | — | — | — | 633,534 | ||||||||||||||||||||||||||||||||||||||||||||
| Chairman of the Board | |||||||||||||||||||||||||||||||||||||||||||||||||||||
| Office of the CEO | |||||||||||||||||||||||||||||||||||||||||||||||||||||
| Christopher Spohn | 2021 | 657,892 | — | 750,140 | — | — | — | 59,698 | 1,467,730 | ||||||||||||||||||||||||||||||||||||||||||||
| EVP of Operations | 2020 | 347,308 | — | 900,508 | — | 342,279 | — | 51,624 | 1,641,719 | ||||||||||||||||||||||||||||||||||||||||||||
| Office of the CEO | — | ||||||||||||||||||||||||||||||||||||||||||||||||||||
| Andrew Clark | 2021 | 203,116 | — | — | — | — | — | 3,182,622 | 3,385,738 | ||||||||||||||||||||||||||||||||||||||||||||
| Former President and CEO (7) | 2020 | 806,490 | — | 1,222,762 | — | 655,056 | — | 91,456 | 2,775,764 | ||||||||||||||||||||||||||||||||||||||||||||
| 2019 | 776,620 | — | 2,486,860 | — | — | — | 1,064,969 | 4,328,449 | |||||||||||||||||||||||||||||||||||||||||||||
| Kevin Royal | 2021 | 395,000 | — | 391,176 | — | — | — | 64,688 | 850,864 | ||||||||||||||||||||||||||||||||||||||||||||
| EVP, Chief Financial Officer | 2020 | 410,192 | — | 382,699 | — | 183,244 | — | 69,027 | 1,045,162 | ||||||||||||||||||||||||||||||||||||||||||||
| 2019 | 395,000 | — | 778,361 | — | — | — | 79,208 | 1,252,569 | |||||||||||||||||||||||||||||||||||||||||||||
| John Semel | 2021 | 500,000 | — | 222,663 | — | 187,500 | — | 72,688 | 982,851 | ||||||||||||||||||||||||||||||||||||||||||||
| EVP, Chief Strategy Officer | 2020 | 503,846 | — | 218,000 | — | 316,301 | — | 75,853 | 1,114,000 | ||||||||||||||||||||||||||||||||||||||||||||
| Diane Thompson | 2021 | 526,683 | — | 221,419 | — | — | — | 72,881 | 820,983 | ||||||||||||||||||||||||||||||||||||||||||||
| Former General Counsel | 2020 | 438,542 | — | 182,074 | — | 178,099 | — | 125,287 | 924,002 | ||||||||||||||||||||||||||||||||||||||||||||
| Office of the CEO | 2019 | 422,300 | — | 370,347 | — | — | — | 110,712 | 903,359 | ||||||||||||||||||||||||||||||||||||||||||||
| Marc Brown | 2021 | 160,000 | — | 173,665 | — | — | — | 431,796 | 765,461 | ||||||||||||||||||||||||||||||||||||||||||||
| Former Chief HR Officer | |||||||||||||||||||||||||||||||||||||||||||||||||||||
| Matthew Hillman | 2021 | 350,000 | — | 128,663 | — | — | — | 69,578 | 548,241 | ||||||||||||||||||||||||||||||||||||||||||||
| SVP, University Partnerships | |||||||||||||||||||||||||||||||||||||||||||||||||||||
| Matt Mitchell | 2021 | 294,200 | — | 162,282 | — | — | — | 28,603 | 485,085 | ||||||||||||||||||||||||||||||||||||||||||||
| General Counsel and Secretary | |||||||||||||||||||||||||||||||||||||||||||||||||||||
(1)2019Represents the grant date fair market value of any RSUs, PSUs and MSUs awarded to the NEOs in each fiscal year, computed in accordance with FASB ASC Topic 718. For the PSU and MSU awards, the grant date fair value of such awards at the time of grant was based upon the probable outcome at the time of grant. The RSUs, PSUs and MSUs are further described under the “Grants of Plan-Based Awards” and “Outstanding Equity Awards at Fiscal Year End” tables below. Assumptions used to calculate these amounts are described in Note 17, “Stock-Based Compensation,” to our annual consolidated financial statements for the year ended December 31, 2021, which are included in our Annual Report on Form 10-K for the year ended December 31, 2021 filed with the SEC on April 15, 2022.
(2) and Represents the aggregate grant date fair value of stock option awards granted to the NEOs in each fiscal year, computed in each case in accordance with FASB ASC Topic 718.
(3)2018Represents the performance-based cash awards earned in each fiscal year under the Company's Short Term Incentive Plan.
(4).There are no nonqualified deferred compensation earnings reflected in this column because no NEO received above-market or preferential earnings on such compensation.
| Name and Principal Position | Year | Salary ($) | Bonus ($) | Stock Awards ($)(1) | Option Awards ($)(2) | Non-Equity Incentive Plan Compensation ($)(3) | Changes in Pension Value and Nonqualified Deferred Compensation Earnings ($)(4) | All Other Compensation ($)(5)(6) | Total ($) | ||||||||||||||||
| Andrew S. Clark | 2019 | 776,620 | — | 2,486,860 | — | — | — | 1,064,969 | 4,328,449 | ||||||||||||||||
| Founder, President and CEO | 2018 | 769,660 | — | 2,398,251 | — | 1,484,092 | — | 68,009 | 4,720,012 | ||||||||||||||||
| Kevin S. Royal | 2019 | 395,000 | — | 778,361 | — | — | — | 79,208 | 1,252,569 | ||||||||||||||||
| EVP, Chief Financial Officer | 2018 | 265,865 | — | 751,138 | — | 416,575 | — | 245,663 | 1,679,241 | ||||||||||||||||
| Gregory J. Finkelstein (7) | 2019 | 413,462 | — | 1,203,579 | — | — | — | 71,186 | 1,688,227 | ||||||||||||||||
| EVP, Chief Operating Officer | |||||||||||||||||||||||||
37
(5)Represents (i) payments for health, life and disability insurance premiums, (ii) medical expense reimbursements received under the Senior Management Benefit Plan, (iii) 401(k) retirement savings plan (the “401(k) Plan”) matching contributions, (iv) reimbursement for housing expenses and (v) nonqualified deferred compensation plan contributions (only to contribute the matching contributions we would have made to the 401(k) Plan on the NEO’s behalf because the NEO’s contributions to the 401(k) Plan were required to be reduced pursuant to applicable plan contribution limitations). Payments for health insurance premiums reflect the full amount paid on behalf of the NEOs rather than the portion in excess of that paid for non-executives. For a breakdown of the amounts comprising the “All Other Compensation” column, see the All Other Compensation Detail table below.
(6)For Mr. Clark, our former CEO, the “All Other Compensation” column for 2019 includes certain relocation allowances.
(7)As previously discussed, Mr. Clark separated from the Company effective March 31, 2021.
38
| Name | Year | Qualified Retirement Plan Employer Match ($) | Employer Deferred Compensation Plan Contributions ($) | Health, Life and Disability Insurance Premiums and Medical Reimbursements ($) | Legal Reimbursement, Housing or Vacation Pay Out ($) | All Other Compensation Total ($) | |||||||||||
| Andrew S. Clark | 2019 | 8,400 | — | 59,564 | 997,005 | 1,064,969 | |||||||||||
| 2018 | 12,250 | — | 55,759 | — | 68,009 | ||||||||||||
| Kevin S. Royal | 2019 | — | — | 59,564 | 19,644 | 79,208 | |||||||||||
| 2018 | — | — | 55,759 | — | 55,759 | ||||||||||||
| Gregory J. Finkelstein (7) | 2019 | 8,435 | — | 61,372 | 1,379 | 71,186 | |||||||||||
| ALL OTHER COMPENSATION DETAIL | ||
| Name | Year | Qualified Retirement Plan Employer Match ($) | Employer Deferred Compensation Plan Contributions ($) | Health, Life and Disability Insurance Premiums and Medical Reimbursements ($) | Severance, Legal Reimbursement, Housing or Vacation Pay Out ($) | All Other Compensation Total ($) | ||||||||||||||||||||||||||||||||
| Randy Hendricks | 2021 | 635 | — | 1,307 | 15 | 1,957 | ||||||||||||||||||||||||||||||||
| George Pernsteiner | 2021 | — | — | — | — | — | ||||||||||||||||||||||||||||||||
| Christopher Spohn | 2021 | — | — | 44,456 | 15,242 | 59,698 | ||||||||||||||||||||||||||||||||
| 2020 | — | — | 28,800 | 22,824 | 51,624 | |||||||||||||||||||||||||||||||||
| Andrew Clark | 2021 | 4,182 | — | 65,932 | 3,112,508 | 3,182,622 | ||||||||||||||||||||||||||||||||
| 2020 | 8,550 | — | 66,497 | 16,409 | 91,456 | |||||||||||||||||||||||||||||||||
| 2019 | 8,400 | — | 59,564 | 997,005 | 1,064,969 | |||||||||||||||||||||||||||||||||
| Kevin Royal | 2021 | — | — | 64,488 | 200 | 64,688 | ||||||||||||||||||||||||||||||||
| 2020 | — | — | 66,497 | 2,530 | 69,027 | |||||||||||||||||||||||||||||||||
| 2019 | — | — | 59,564 | 19,644 | 79,208 | |||||||||||||||||||||||||||||||||
| John Semel | 2021 | 8,000 | — | 64,488 | 200 | 72,688 | ||||||||||||||||||||||||||||||||
| 2020 | 7,923 | — | 66,497 | 1,433 | 75,853 | |||||||||||||||||||||||||||||||||
| Diane Thompson | 2021 | 8,700 | — | 40,447 | 23,734 | 72,881 | ||||||||||||||||||||||||||||||||
| 2020 | 8,550 | — | 41,605 | 75,132 | 125,287 | |||||||||||||||||||||||||||||||||
| 2019 | 8,769 | — | 37,471 | 64,472 | 110,712 | |||||||||||||||||||||||||||||||||
| Marc Brown | 2021 | 4,433 | — | 64,712 | 362,651 | 431,796 | ||||||||||||||||||||||||||||||||
| Matthew Hillman | 2021 | 4,890 | — | 64,488 | 200 | 69,578 | ||||||||||||||||||||||||||||||||
| Matt Mitchell | 2021 | 8,700 | — | 19,703 | 200 | 28,603 | ||||||||||||||||||||||||||||||||
39
| GRANTS OF PLAN-BASED AWARDS | ||
The following table provides information regarding grants of plan-based awards to each of our NEOs during 2021.
| Name | Grant Date | Approval Date | Estimated Future Payouts Under Non-Equity Incentive Plan Awards (1) | Estimated Future Payouts Under Equity Incentive Plan Awards (2) | All Other Stock Awards: Number of Shares of Stock or Units (#) | Grant Date Fair Value of Stock Awards (3)($) | ||||||||||||||||||||||||||||||||||||||||||||||||||||||||
| Threshold ($) | Target ($) | Maximum ($) | Threshold (#) | Target (#) | Maximum (#) | |||||||||||||||||||||||||||||||||||||||||||||||||||||||||
| Hendricks | — | — | — | — | — | — | — | — | — | — | ||||||||||||||||||||||||||||||||||||||||||||||||||||
| 12/6/21 | 12/1/21 | — | — | — | — | — | — | 574,138 | 838,241 | |||||||||||||||||||||||||||||||||||||||||||||||||||||
| 12/6/21 | 12/1/21 | — | — | — | 690,000 | 1,150,000 | 2,300,000 | — | 1,518,000 | |||||||||||||||||||||||||||||||||||||||||||||||||||||
| Pernsteiner | — | — | — | — | — | — | — | — | — | — | ||||||||||||||||||||||||||||||||||||||||||||||||||||
| 3/29/21 | 3/15/21 | — | — | — | — | — | — | 16,410 | 69,743 | |||||||||||||||||||||||||||||||||||||||||||||||||||||
| 4/7/21 | 4/7/21 | — | — | — | — | — | — | 20,450 | 70,962 | |||||||||||||||||||||||||||||||||||||||||||||||||||||
| Spohn | — | — | 301,875 | 603,750 | 1,207,500 | — | — | — | — | — | ||||||||||||||||||||||||||||||||||||||||||||||||||||
| 4/7/21 | 4/7/21 | — | — | — | — | — | — | 10,220 | 35,463 | |||||||||||||||||||||||||||||||||||||||||||||||||||||
| 5/31/21 | 5/27/31 | — | — | — | — | — | — | 111,490 | 262,002 | |||||||||||||||||||||||||||||||||||||||||||||||||||||
| 5/31/21 | 5/27/31 | — | — | — | 115,500 | 192,500 | 385,000 | — | 481,250 | |||||||||||||||||||||||||||||||||||||||||||||||||||||
| Clark | — | — | 388,310 | 776,620 | 1,553,240 | — | — | — | — | — | ||||||||||||||||||||||||||||||||||||||||||||||||||||
| Royal | — | — | 108,625 | 217,250 | 434,500 | — | — | — | — | — | ||||||||||||||||||||||||||||||||||||||||||||||||||||
| 5/31/21 | 5/27/31 | — | — | — | — | — | — | 61,000 | 143,350 | |||||||||||||||||||||||||||||||||||||||||||||||||||||
| 5/31/21 | 5/27/31 | — | — | — | 63,198 | 105,330 | 210,660 | — | 263,325 | |||||||||||||||||||||||||||||||||||||||||||||||||||||
| Semel | — | — | 187,500 | 375,000 | 750,000 | — | — | — | — | — | ||||||||||||||||||||||||||||||||||||||||||||||||||||
| 5/31/21 | 5/27/31 | — | — | — | — | — | — | 34,750 | 81,663 | |||||||||||||||||||||||||||||||||||||||||||||||||||||
| 5/31/21 | 5/27/31 | — | — | — | 36,000 | 60,000 | 120,000 | — | 150,000 | |||||||||||||||||||||||||||||||||||||||||||||||||||||
| Thompson | — | — | 105,575 | 211,150 | 422,300 | — | — | — | — | — | ||||||||||||||||||||||||||||||||||||||||||||||||||||
| 4/7/21 | 4/7/21 | — | — | — | — | — | — | 10,220 | 35,463 | |||||||||||||||||||||||||||||||||||||||||||||||||||||
| 5/31/21 | 5/27/31 | — | — | — | — | — | — | 29,020 | 68,197 | |||||||||||||||||||||||||||||||||||||||||||||||||||||
| 5/31/21 | 5/27/31 | — | — | — | 30,066 | 50,110 | 100,220 | — | 125,275 | |||||||||||||||||||||||||||||||||||||||||||||||||||||
| Brown | — | — | 85,800 | 171,600 | 343,200 | — | — | — | — | — | ||||||||||||||||||||||||||||||||||||||||||||||||||||
| 5/31/21 | 5/27/31 | — | — | — | — | — | — | 27,100 | 63,685 | |||||||||||||||||||||||||||||||||||||||||||||||||||||
| 5/31/21 | 5/27/31 | — | — | — | 28,080 | 46,800 | 93,600 | — | 117,000 | |||||||||||||||||||||||||||||||||||||||||||||||||||||
| Hillman | — | — | 113,750 | 227,500 | 455,000 | — | — | — | — | — | ||||||||||||||||||||||||||||||||||||||||||||||||||||
| 5/31/21 | 5/27/31 | — | — | — | — | — | — | 20,080 | 47,188 | |||||||||||||||||||||||||||||||||||||||||||||||||||||
| 5/31/21 | 5/27/31 | — | — | — | 20,802 | 34,670 | 69,340 | — | 86,675 | |||||||||||||||||||||||||||||||||||||||||||||||||||||
| Mitchell | — | — | 57,680 | 115,360 | 230,720 | — | — | — | — | — | ||||||||||||||||||||||||||||||||||||||||||||||||||||
| 5/31/21 | 5/27/31 | — | — | — | — | — | — | 12,920 | 30,362 | |||||||||||||||||||||||||||||||||||||||||||||||||||||
| 8/31/21 | 8/25/21 | — | — | — | — | — | — | 12,330 | 31,811 | |||||||||||||||||||||||||||||||||||||||||||||||||||||
| 5/31/21 | 5/27/31 | — | — | — | 13,380 | 22,300 | 44,600 | — | 55,750 | |||||||||||||||||||||||||||||||||||||||||||||||||||||
| 8/31/21 | 8/25/21 | — | — | — | 11,094 | 18,490 | 36,980 | — | 50,663 | |||||||||||||||||||||||||||||||||||||||||||||||||||||
(1) The threshold, target and maximum amounts shown correspond to potential performance-based cash bonuses pursuant to the 2021 STI Plan based upon the achievement of certain performance goals. The threshold, target and maximum amounts shown above assume threshold, target and maximum achievement, respectively, for each of the weighted performance goals. For additional information regarding the STI Plan, including the performance-based cash bonuses, performance targets and methodology for determining bonus amounts, see “2021 Short Term Incentive Plan” above. Actual payouts to the NEOs under the 2021 STI Plan for achievement of the 2021 performance goals are reflected in the “Non-Equity Incentive Plan Compensation” column of the Summary Compensation Table above.
40
(2) The target amount represents the PSU shares that the Compensation Committee awarded the NEOs. These PSUs also have minimum and maximum amounts that each NEO could receive for achieving certain performance targets.
(3) Represents the grant date fair value of the respective RSU and PSU awards. The RSUs are calculated using closing market price on the date of grant. The PSUs are calculated using the Monte Carlo value on the date of grant. As the PSUs are subject to a three-year cumulative EBITDA target, with the total payout subject to an rTSR modifier, the amount included for future awards represent the service inception date fair value multiplied by the target number of shares. The Monte Carlo fair value applied to the PSU awards granted on May 31, 2021, August 31, 2021 and December 6, 2021, were $2.50, $2.74 and $1.32, respectively. Assumptions used to calculate these amounts are further described in Note 17, “Stock-Based Compensation,” to our annual consolidated financial statements for the year ended December 31, 2021, which are included in our Annual Report on Form 10-K for the year ended December 31, 2021 filed with the SEC on April 15, 2022.
41
| OUTSTANDING EQUITY AWARDS | ||
The following table shows the number of shares of our common stock subject to outstanding stock options, RSUs, PSUs and MSUs held by our NEOs as of December 31, 20192021.
| Outstanding Equity Awards at Fiscal Year End | ||||||||||||||||||||||||||||||||||||||||||||||||||
| Option Awards | Stock Unit Awards | |||||||||||||||||||||||||||||||||||||||||||||||||
| Name | Securities underlying unexercised options (#) exercisable | Securities underlying unexercised options (#) unexercisable | Option exercise price ($) | Option expiration date | Number of stock units that have not vested (#) | Market value of all stock units that have not vested ($)(1) | Equity Incentive Plan Awards: Number of Unearned Shares that have not vested (#) | Equity Incentive Plan Awards: Market or Payout Value of Unearned Shares that have not vested (1) | ||||||||||||||||||||||||||||||||||||||||||
| Mr. Hendricks | — | — | — | — | 574,138 | 729,155 | (2) | — | — | |||||||||||||||||||||||||||||||||||||||||
| — | — | — | — | — | — | 1,150,000 | 1,460,500 | (3) | ||||||||||||||||||||||||||||||||||||||||||
| Mr Pernsteiner | — | — | — | — | 16,410 | 20,841 | (4) | — | — | |||||||||||||||||||||||||||||||||||||||||
| — | — | — | — | 20,450 | 25,972 | (5) | — | — | ||||||||||||||||||||||||||||||||||||||||||
| Mr. Spohn | — | — | — | — | 82,417 | 104,670 | (6) | — | — | |||||||||||||||||||||||||||||||||||||||||
| — | — | — | — | 85,553 | 108,652 | (7) | — | — | ||||||||||||||||||||||||||||||||||||||||||
| — | — | — | — | 111,490 | 141,592 | (8) | — | — | ||||||||||||||||||||||||||||||||||||||||||
| — | — | — | — | — | — | 192,500 | 244,475 | (9) | ||||||||||||||||||||||||||||||||||||||||||
| — | — | — | — | — | — | 192,500 | 244,475 | (10) | ||||||||||||||||||||||||||||||||||||||||||
| Mr. Clark | 122,750 | — | 24.75 | 3/30/22 | (11)(12) | — | — | — | — | |||||||||||||||||||||||||||||||||||||||||
| 125,900 | — | 10.23 | 3/29/23 | (11)(13) | — | — | — | — | ||||||||||||||||||||||||||||||||||||||||||
| 114,230 | — | 14.50 | 3/29/24 | (11)(14) | — | — | — | — | ||||||||||||||||||||||||||||||||||||||||||
| 105,952 | — | 9.43 | 3/29/25 | (11)(15) | — | — | — | — | ||||||||||||||||||||||||||||||||||||||||||
| 100,270 | — | 10.59 | 3/29/26 | (11)(16) | — | — | — | — | ||||||||||||||||||||||||||||||||||||||||||
| 104,070 | — | 10.44 | 3/29/27 | (11)(17) | — | — | — | — | ||||||||||||||||||||||||||||||||||||||||||
| — | — | — | — | — | — | 150,870 | 191,605 | (20) | ||||||||||||||||||||||||||||||||||||||||||
| Mr. Royal | — | — | — | — | 10,020 | 12,725 | (21) | — | — | |||||||||||||||||||||||||||||||||||||||||
| — | — | — | — | 31,854 | 40,455 | (19) | — | — | ||||||||||||||||||||||||||||||||||||||||||
| — | — | — | — | 46,813 | 59,453 | (7) | — | — | ||||||||||||||||||||||||||||||||||||||||||
| — | — | — | — | 61,000 | 77,470 | (8) | — | — | ||||||||||||||||||||||||||||||||||||||||||
| — | — | — | — | — | — | 47,220 | 59,969 | (20) | ||||||||||||||||||||||||||||||||||||||||||
| — | — | — | — | — | — | 105,330 | 133,769 | (9) | ||||||||||||||||||||||||||||||||||||||||||
| — | — | — | — | — | — | 105,330 | 133,769 | (10) | ||||||||||||||||||||||||||||||||||||||||||
| Mr. Semel | — | — | — | — | 18,144 | 23,043 | (19) | — | — | |||||||||||||||||||||||||||||||||||||||||
| — | — | — | — | 26,666 | 33,866 | (7) | — | — | ||||||||||||||||||||||||||||||||||||||||||
| — | — | — | — | 34,750 | 44,133 | (8) | — | — | ||||||||||||||||||||||||||||||||||||||||||
| — | — | — | — | — | — | 26,900 | 34,163 | (20) | ||||||||||||||||||||||||||||||||||||||||||
| — | — | — | — | — | — | 60,000 | 76,200 | (9) | ||||||||||||||||||||||||||||||||||||||||||
| — | — | — | — | — | — | 60,000 | 76,200 | (10) | ||||||||||||||||||||||||||||||||||||||||||
| Ms. Thompson | 38,870 | — | 24.75 | 44,650 | (11)(12) | — | — | — | — | |||||||||||||||||||||||||||||||||||||||||
| 31,470 | — | 10.23 | 45,014 | (11)(13) | — | — | — | — | ||||||||||||||||||||||||||||||||||||||||||
| 26,110 | — | 14.50 | 45,380 | (11)(14) | — | — | — | — | ||||||||||||||||||||||||||||||||||||||||||
| 25,198 | — | 9.43 | 45,745 | (11)(15) | — | — | — | — | ||||||||||||||||||||||||||||||||||||||||||
| 23,830 | — | 10.59 | 46,110 | (11)(16) | — | — | — | — | ||||||||||||||||||||||||||||||||||||||||||
| 24,730 | — | 10.44 | 46,475 | (11)(17) | — | — | — | — | ||||||||||||||||||||||||||||||||||||||||||
| — | — | — | — | 6,772 | 8,600 | (18) | — | — | ||||||||||||||||||||||||||||||||||||||||||
| — | — | — | — | 15,154 | 19,246 | (19) | — | — | ||||||||||||||||||||||||||||||||||||||||||
| — | — | — | — | 22,273 | 28,287 | (7) | — | — | ||||||||||||||||||||||||||||||||||||||||||
| — | — | — | — | 29,020 | 36,855 | (8) | — | — | ||||||||||||||||||||||||||||||||||||||||||
| Outstanding Equity Awards at Fiscal Year End | |||||||||||||||||||||
| Option Awards | Stock Unit Awards | ||||||||||||||||||||
| Name | Number of securities underlying unexercised options (#) exercisable | Number of securities underlying unexercised options (#) unexercisable | Option exercise price ($) | Option expiration date | Number of stock units that have not vested (#) | Market value of stock units that have not vested ($)(1) | |||||||||||||||
| Andrew S. Clark | 125,100 | — | 15.81 | 8/5/2020 | (2)(3) | — | — | ||||||||||||||
| 134,160 | — | 17.10 | 3/31/2021 | (2)(4) | — | — | |||||||||||||||
| 122,750 | — | 24.75 | 3/30/2022 | (2)(5) | — | — | |||||||||||||||
| 125,900 | — | 10.23 | 3/29/2023 | (2)(6) | — | — | |||||||||||||||
| 114,230 | — | 14.50 | 3/29/2024 | (2)(7) | — | — | |||||||||||||||
| 105,952 | — | 9.43 | 3/29/2025 | (2)(8) | — | — | |||||||||||||||
| 91,246 | 9,024 | 10.59 | 3/29/2026 | (2)(9) | — | — | |||||||||||||||
| 69,727 | 34,343 | 10.44 | 3/29/2027 | (2)(10) | — | — | |||||||||||||||
| — | — | — | — | 11,915 | (11) | 24,545 | |||||||||||||||
| — | — | — | — | 24,220 | (12) | 49,893 | |||||||||||||||
| — | — | — | — | 94,395 | (13) | 194,454 | |||||||||||||||
| — | — | — | — | 80,980 | (14) | 166,819 | |||||||||||||||
| — | — | — | — | 68,340 | (15) | 140,780 | |||||||||||||||
| — | — | — | — | 203,550 | (17) | 419,313 | |||||||||||||||
| — | — | — | — | 150,870 | (18) | 310,792 | |||||||||||||||
| Kevin S. Royal | — | — | — | — | 30,060 | (16) | 61,924 | ||||||||||||||
| — | — | — | — | 24,820 | (14) | 51,129 | |||||||||||||||
| — | — | — | — | 20,940 | (15) | 43,136 | |||||||||||||||
| — | — | — | — | 63,710 | (17) | 131,243 | |||||||||||||||
| — | — | — | — | 47,220 | (18) | 97,273 | |||||||||||||||
| Gregory J. Finkelstein | — | — | — | — | 21,397 | (19) | 44,078 | ||||||||||||||
| — | — | — | — | 79,760 | (17) | 164,306 | |||||||||||||||
| — | — | — | — | 59,120 | (18) | 121,787 | |||||||||||||||
42
| Mr. Hillman | — | — | — | — | 3,853 | 4,893 | (22) | — | — | |||||||||||||||||||||||||||||||||||||||||
| — | — | — | — | 20,080 | 25,502 | (8) | — | — | ||||||||||||||||||||||||||||||||||||||||||
| — | — | — | — | — | — | 8,670 | 11,011 | (23) | ||||||||||||||||||||||||||||||||||||||||||
| — | — | — | — | — | — | 34,670 | 44,031 | (10) | ||||||||||||||||||||||||||||||||||||||||||
| Mr. Mitchell | 3,719 | — | 9.43 | 3/29/25 | — | — | — | — | ||||||||||||||||||||||||||||||||||||||||||
| — | — | — | — | 2,287 | 2,904 | (18) | — | — | ||||||||||||||||||||||||||||||||||||||||||
| — | — | — | — | 6,744 | 8,565 | (19) | — | — | ||||||||||||||||||||||||||||||||||||||||||
| — | — | — | — | 9,913 | 12,590 | (7) | — | — | ||||||||||||||||||||||||||||||||||||||||||
| — | — | — | — | 12,920 | 16,408 | (8) | — | — | ||||||||||||||||||||||||||||||||||||||||||
| — | — | — | — | 12,330 | 15,659 | (24) | — | — | ||||||||||||||||||||||||||||||||||||||||||
| — | — | — | — | — | — | 10,000 | 12,700 | (20) | ||||||||||||||||||||||||||||||||||||||||||
| — | — | — | — | — | — | 22,300 | 28,321 | (9) | ||||||||||||||||||||||||||||||||||||||||||
| — | — | — | — | — | — | 22,300 | 28,321 | (10) | ||||||||||||||||||||||||||||||||||||||||||
| — | — | — | — | — | — | 18,490 | 23,482 | (25) | ||||||||||||||||||||||||||||||||||||||||||
(1) The calculated value is based on the closing price of our common stock of $1.27 as reported by the Nasdaq on December 31, 2021.
(2) These RSUs were granted under the 2021 CEO Inducement Equity Incentive Plan on December 6, 2021 to Mr. Hendricks, and 33% of the RSUs will vest and be delivered to Mr. Hendricks on each anniversary of the grant date, subject to Mr. Hendrick’s continuing service with us through each such date.
(3) These PSUs were granted under the 2021 CEO Inducement Equity Incentive Plan on December 6, 2021 to Mr. Hendricks, and will be eligible to vest and be delivered to Mr. Hendricks on the third anniversary of the grant date, subject to certain performance and market criteria, and subject to Mr. Hendrick’s continuing service with us through each such date.
(4) These RSUs were granted under the 2009 Plan on April 7, 2021 to Mr. Pernsteiner, and 100% of the RSUs will vest and be delivered to Mr. Pernsteiner on the one year anniversary of the grant date.
(5) These RSUs were granted under the 2009 Plan on March 31, 2021 to Mr. Pernsteiner, and 100% of the RSUs will vest and be delivered to Mr. Pernsteiner on the one year anniversary of the grant date.
(6) These RSUs were granted under the 2009 Plan on May 7, 2020 to Mr. Spohn, and 25% of the RSUs will vest and be delivered to Mr. Spohn on each anniversary of the grant date, subject to Mr. Spohn’s continuing service with us through each such date.
(7) These RSUs were granted under the 2009 Plan on May 12, 2020, and 33% of the RSUs will vest and be delivered to the NEO on each anniversary of the grant date, subject to the NEO’s continuing service with us through each such date.
(8) These RSUs were granted under the 2009 Plan on May 31, 2021, and 33% of the RSUs will vest and be delivered to the NEO on each anniversary of the grant date, subject to the NEO’s continuing service with us through each such date.
(9) These PSUs were granted under the 2009 Plan on May 12, 2020, and vesting is predicated on multiple factors, including a free cash flow metric.
(10) These PSUs were granted under the 2009 Plan on May 31, 2021, and vesting is predicated on multiple factors, including a EBITDA target and a relative TSR metric.
(11) These stock options vest as follows, subject to the NEO’s continued service with us: (i) 25% of the option vests on the first anniversary of the vesting commencement date, (ii) an additional 2% of the option vests on each monthly anniversary of the vesting commencement date for the 33 months following the first anniversary of the vesting commencement date and (iii) an additional 3% of the option vests on each of the 46th, 47th and 48th monthly anniversaries of the vesting commencement date.
(12) These options were granted under the 2009 Plan on March 30, 2012, with an exercise price equal to the regular session closing price of our common stock on the date of grant. The vesting commencement date was March 30, 2012.
(13) These options were granted under the 2009 Plan on March 29, 2013, with an exercise price equal to the regular session closing price of our common stock on the date of grant. The vesting commencement date was March 29, 2013.
(14) These options were granted under the 2009 Plan on March 29, 2014, with an exercise price equal to the regular session closing price of our common stock on the date of grant. The vesting commencement date was March 29, 2014.
(15) These options were granted under the 2009 Plan on March 29, 2015, with an exercise price equal to the regular session closing price of our common stock on the date of grant. The vesting commencement date was March 29, 2015.
(16) These options were granted under the 2009 Plan on March 29, 2016, with an exercise price equal to the regular session closing price of our common stock on the date of grant. The vesting commencement date was March 29, 2016.
43
(17) These options were granted under the 2009 Plan on March 29, 2017, with an exercise price equal to the regular session closing price of our common stock on the date of grant. The vesting commencement date was March 29, 2017.
(18) These RSUs were granted under the 2009 Plan on March 29, 2018, and 25% of the RSUs will vest and be delivered to the NEO on each anniversary of the grant date, subject to the NEO’s continuing service with us through each such date.
(19) These RSUs were granted under the 2009 Plan on March 29, 2019, and 25% of the RSUs will vest and be delivered to the NEO on each anniversary of the grant date, subject to the NEO’s continuing service with us through each such date.
(20) These PSUs were granted under the 2009 Plan on March 29, 2019, and vesting is predicated on multiple factors, including: (i) the obtaining of a new client within three years, (ii) a share price decline by 40% or more would result in no MSUs vesting, and (iii) more or less MSUs at more or less than grant price can vest based on the share price at the date of vesting.
(21) These RSUs were granted under the 2009 Plan on May 31, 2018 to Mr. Royal, and 25% of the RSUs will vest and be delivered to Mr. Royal on each anniversary of the grant date, subject to Mr. Royal's continuing service with us through each such date.
(22) These RSUs were granted under the 2009 Plan on November 30, 2020, and 33% of the RSUs will vest and be delivered to the NEO on each anniversary of the grant date, subject to the NEO’s continuing service with us through each such date.
(23) These PSUs were granted under the 2009 Plan on November 30, 2020, and vesting is predicated on multiple factors, including a free cash flow metric.
(24) These RSUs were granted under the 2009 Plan on August 31, 2021, and 33% of the RSUs will vest and be delivered to the NEO on each anniversary of the grant date, subject to the NEO’s continuing service with us through each such date.
(25) These PSUs were granted under the 2009 Plan on August 31, 2021, and vesting is predicated on multiple factors, including a EBITDA target and a relative TSR metric.
| OPTION EXERCISES AND STOCK VESTED | ||
The following table provides information for the NEOs regarding (i) any stock options exercised during 2021, including the total number of shares acquired upon exercise and the aggregate value realized before payment of any applicable withholding tax and broker commissions, and (ii) any RSUs vested during 2021.
| Option Awards | Stock Awards | |||||||||||||||||||||||||
| Name | Number of shares acquired on exercise (#) | Value realized on exercise ($)(1) | Number of shares acquired on vesting (#) | Value realized on vesting ($)(2) | ||||||||||||||||||||||
| Randy Hendricks | — | — | — | — | ||||||||||||||||||||||
| George Pernsteiner | — | — | 21,252 | 86,376 | ||||||||||||||||||||||
| Christopher Spohn | — | — | 80,470 | 225,344 | ||||||||||||||||||||||
| Andrew Clark | — | — | 326,389 | 1,357,297 | ||||||||||||||||||||||
| Kevin Royal | — | — | 49,355 | 190,721 | ||||||||||||||||||||||
| John Semel | — | — | 22,407 | 95,230 | ||||||||||||||||||||||
| Diane Thompson | — | — | 38,584 | 143,440 | ||||||||||||||||||||||
| Marc Brown | — | — | 23,324 | 99,127 | ||||||||||||||||||||||
| Matthew Hillman | — | — | 1,927 | 2,640 | ||||||||||||||||||||||
| Matt Mitchell | — | — | 12,072 | 51,306 | ||||||||||||||||||||||
(1) The value realized for a stock option exercise is determined by multiplying (i) the number of shares acquired upon exercise by (ii) the difference between the market price of the shares at exercise and the exercise price of the stock option.
(2) The value realized upon vesting of RSUs is determined by multiplying (i) the number of shares vested by (ii) the market price of the shares at vesting.
44
| EMPLOYMENT AGREEMENTS | ||
The following table and accompanying footnotes summarize the material terms contained in the employment agreement we entered into with Mr. Clark in March 2015 and the employment agreement we entered into with Mr. Finkelstein effective December 31, 2018.Spohn in April 2020. Once the employment agreement for Mr. Finkelstein separated from Zovio as Executive Vice President and Chief Operating Officer effective March 12, 2020.Spohn expires in April 2022, we will not have employment agreements. We do not currently have anany employment agreementagreements with Mr. Royal,any of our other NEO's, who isare instead a participant in, and may receive severance benefits pursuant to, the Amended and Restated Executive Severance Plan and hisany Severance Agreement executed thereunder, as described under “Potential Payments upon Termination and Change of Control” below. Pursuant to the terms of their employment, each of our NEOs is entitled to participate in health, insurance, retirement and other benefits that are provided to our senior executives.
| Name | Position | Effective Date of Agreement | Initial Term of Agreement (1) | Base Salary ($)(2) | Annual Target Bonus, as Percentage of Salary (3) | Potential Payments upon Termination or Change of Control | ||||||||||||||||||||||||||||||||||||||
| Christopher Spohn | Executive Vice President of Operations | April 30, 2020 | 2 years | 525,000 | 115 | % | (4) | |||||||||||||||||||||||||||||||||||||
| Andrew Clark | Former President and Chief Executive Officer | March 9, 2015 | 3 years | 725,000 | 100 | % | (4) | |||||||||||||||||||||||||||||||||||||
| Name | Position | Date of Agreement | Initial Term of Agreement (1) | Base Salary ($)(2) | Annual Target Bonus, as Percentage of Salary (3) | Potential Payments upon Termination or Change of Control | Other | |||||||||
| Andrew S. Clark | Founder, President and Chief Executive Officer | March 9, 2015 | 3 years | 725,000 | 100 | % | (4) | (5) | ||||||||
| Gregory J. Finkelstein | Former Executive Vice President, Chief Operating Officer | December 31, 2018 | 3 years | 430,000 | 70 | % | (4) | |||||||||
(2) This column shows the initial annual base salary set forth in the related employment agreement, which salary may be periodically reviewed and increased by the Board in its discretion, or decreased with such executive’s written consent. (3) The employment agreement for Mr. Clark provided that he would have been eligible for an annual discretionary incentive bonus based on the attainment of certain performance criteria. The employment agreement provided for a target bonus amount as a percentage of annual salary, which target percentage is reflected in this column. The actual bonus paid may have been more or less than the target amount, as determined by the Board or the Compensation Committee. Upon his separation from the Company, Mr. Clark was eligible to receive his annual cash bonus for the prior fiscal year to the extent such bonus had not yet been paid. In addition, upon his separation from the Company, Mr. Clark was eligible to be paid a pro-rata portion of his annual cash bonus for the fiscal year of termination based on the percentage of time he was employed in fiscal year 2021. (4) For information regarding severance and other payments that Messrs. Spohn and Clark would have received, under their employment agreement in the event of a termination of employment and/or a change of control, see “Potential |
| POTENTIAL PAYMENTS UPON TERMINATION AND CHANGE OF CONTROL | ||
The table below provides estimates for compensation payable to the NEOs in hypothetical termination of employment and change of control scenarios under our compensatory arrangements with such executives, other than nondiscriminatory arrangements generally available to salaried employees. The table below does not include Mr. Pernsteiner or Ms. Thompson, as these individuals are no longer an employee by the company and a triggering event did not occur.
The amounts shown in the table below are estimates and assume the hypothetical termination, resignation, death, disability or change of control, as applicable, occurred on December 31, 2019,2021, applying the provisions of the agreements that are in effect as of the date of this proxy statement. If any such executive resigns without “Good Reason” or is terminated by us for “Cause” (each as defined below), such executive will be entitled only to any accrued and unpaid salary and vested benefits and no severance benefits. Due to the number of factors and assumptions that can affect the nature and amount of any benefits provided upon the events discussed below, any amounts paid or distributed upon an actual event may differ.
For purposes of the hypothetical payment estimates shown in the below table, some of the important assumptions that were made are as follows: (i) the NEO’s base salary as in effect as of December 31, 2019;2021; (ii) severance benefits as provided under the NEO’s respective employment agreement or the Amended and Restated Executive Severance Plan and related Severance Agreement; (iii) value for payment of health insurance continuation, including dental, at an assumed value of $3,500 per month; (iv) no discretionary acceleration of vesting of RSUs held by the NEO in the event of a “Change of Control” (as
defined below) and (v) a price per share of our common stock of $2.06,$1.27, based on the closing price of our common stock as reported by Nasdaq on December 31, 20192021.
| Name | Change of Control (1) | Termination of Employee Without Cause, or Resignation by Employee for Good Reason (2)(3) | Termination of Employee without Cause, or Resignation by Employee for Good Reason, within 24 Months of Change of Control (1)(2)(3) | Termination of Employee for Death | Termination of Employee for Disability (4) | ||||||||||||||||||||
| Andrew S. Clark | |||||||||||||||||||||||||
| Cash Severance Payment | $ | — | $ | 3,106,480 | (7) | $ | 3,106,480 | (10) | $ | 388,310 | (13) | $ | 388,310 | (13) | |||||||||||
| Non-Equity Incentive Plan Compensation | $ | — | $ | 776,620 | (7) | $ | 776,620 | (10) | $ | — | (13) | $ | — | (13) | |||||||||||
| Continuation of Health Insurance Benefits | $ | — | $ | 84,000 | (7) | $ | 84,000 | (10) | $ | 21,000 | (13) | $ | 21,000 | (13) | |||||||||||
| Acceleration of Vesting of Stock Options | $ | — | $ | — | (7) | $ | — | (10) | $ | — | (13) | $ | — | (13) | |||||||||||
| Acceleration of Vesting of Stock Awards | $ | 879,082 | (5)(6) | $ | 385,957 | (7) | $ | 1,306,596 | (10) | $ | 385,957 | (13) | $ | 385,957 | (13) | ||||||||||
| Total | $ | 879,082 | $ | 4,353,057 | $ | 5,273,696 | $ | 795,267 | $ | 795,267 | |||||||||||||||
| Kevin Royal | |||||||||||||||||||||||||
| Cash Severance Payment | $ | — | $ | 395,000 | (8) | $ | 395,000 | (11) | $ | — | $ | — | |||||||||||||
| Non-Equity Incentive Plan Compensation | $ | — | $ | 217,250 | (8) | $ | 217,250 | (11) | $ | — | $ | — | |||||||||||||
| Continuation of Health Insurance Benefits | $ | — | $ | 21,000 | (8) | $ | 21,000 | (11) | $ | — | $ | — | |||||||||||||
| Acceleration of Vesting of Stock Options | $ | — | $ | — | (8) | $ | — | (11) | $ | — | $ | — | |||||||||||||
| Acceleration of Vesting of Stock Awards | $ | 140,410 | (6) | $ | 105,740 | (8) | $ | 287,432 | (11) | $ | — | $ | — | ||||||||||||
| Total | $ | 140,410 | $ | 738,990 | $ | 920,682 | $ | — | $ | — | |||||||||||||||
| Gregory J. Finkelstein | |||||||||||||||||||||||||
| Cash Severance Payment | $ | — | $ | 1,096,500 | (9) | $ | 1,096,500 | (12) | $ | 215,000 | (14) | $ | 215,000 | (14) | |||||||||||
| Non-Equity Incentive Plan Compensation | $ | — | $ | 301,000 | (9) | $ | 301,000 | (12) | $ | — | (14) | $ | — | (14) | |||||||||||
| Continuation of Health Insurance Benefits | $ | — | $ | 63,000 | (9) | $ | 63,000 | (12) | $ | 21,000 | (14) | $ | 21,000 | (14) | |||||||||||
| Acceleration of Vesting of Stock Options | $ | — | $ | — | (9) | $ | — | (12) | $ | — | (14) | $ | — | (14) | |||||||||||
| Acceleration of Vesting of Stock Awards | $ | 121,787 | (6) | $ | 85,154 | (9) | $ | 208,383 | (12) | $ | 85,154 | (14) | $ | 85,154 | (14) | ||||||||||
| Total | $ | 121,787 | $ | 1,545,654 | $ | 1,668,883 | $ | 321,154 | $ | 321,154 | |||||||||||||||
45
| Name | Change of Control (1) | Termination of Employee Without Cause, or Resignation by Employee for Good Reason (2)(3) | Termination of Employee without Cause, or Resignation by Employee for Good Reason, within 24 Months of Change of Control (1)(2)(3) | Termination of Employee for Death | Termination of Employee for Disability (4) | ||||||||||||||||||||||||||||||||||||||||||
| Randy Hendricks | |||||||||||||||||||||||||||||||||||||||||||||||
| Cash Severance Payment | $ | — | $ | 550,000 | (6) | $ | 550,000 | (8) | $ | — | $ | — | |||||||||||||||||||||||||||||||||||
| Non-Equity Incentive Plan Compensation | $ | — | $ | 632,500 | (6) | $ | 632,500 | (8) | $ | — | $ | — | |||||||||||||||||||||||||||||||||||
| Continuation of Health Insurance Benefits | $ | — | $ | 84,000 | (6) | $ | 84,000 | (8) | $ | — | $ | — | |||||||||||||||||||||||||||||||||||
| Acceleration of Vesting of Stock Awards | $ | — | $ | 243,053 | (6) | $ | 2,189,655 | (8) | $ | — | $ | — | |||||||||||||||||||||||||||||||||||
| Total | $ | — | $ | 1,509,553 | $ | 3,456,155 | $ | — | $ | — | |||||||||||||||||||||||||||||||||||||
| Christopher Spohn | |||||||||||||||||||||||||||||||||||||||||||||||
| Cash Severance Payment | $ | — | $ | 1,693,125 | (7) | $ | 1,693,125 | (9) | $ | 262,500 | (10) | $ | 262,500 | (10) | |||||||||||||||||||||||||||||||||
| Non-Equity Incentive Plan Compensation | $ | — | $ | 603,750 | (7) | $ | 603,750 | (9) | $ | — | (10) | $ | — | (10) | |||||||||||||||||||||||||||||||||
| Continuation of Health Insurance Benefits | $ | — | $ | 63,000 | (7) | $ | 63,000 | (9) | $ | 21,000 | (10) | $ | 21,000 | (10) | |||||||||||||||||||||||||||||||||
| Acceleration of Vesting of Stock Awards | $ | — | (5) | $ | 136,416 | (7) | $ | 843,864 | (9) | $ | 136,416 | (10) | $ | 136,416 | (10) | ||||||||||||||||||||||||||||||||
| Total | $ | — | $ | 2,496,291 | $ | 3,203,739 | $ | 419,916 | $ | 419,916 | |||||||||||||||||||||||||||||||||||||
| Andrew Clark | |||||||||||||||||||||||||||||||||||||||||||||||
| Cash Severance Payment | $ | — | $ | 3,106,480 | (11) | $ | — | $ | — | $ | — | ||||||||||||||||||||||||||||||||||||
| Continuation of Health Insurance Benefits | $ | — | $ | 102,834 | (11) | $ | — | $ | — | $ | — | ||||||||||||||||||||||||||||||||||||
| Acceleration of Vesting of Stock Options | $ | — | $ | 471,744 | (11) | $ | — | $ | — | $ | — | ||||||||||||||||||||||||||||||||||||
| Total | $ | — | $ | 3,681,058 | $ | — | $ | — | $ | — | |||||||||||||||||||||||||||||||||||||
| Kevin Royal | |||||||||||||||||||||||||||||||||||||||||||||||
| Cash Severance Payment | $ | — | $ | 395,000 | (6) | $ | 395,000 | (8) | $ | — | $ | — | |||||||||||||||||||||||||||||||||||
| Non-Equity Incentive Plan Compensation | $ | — | $ | 217,250 | (6) | $ | 217,250 | (8) | $ | — | $ | — | |||||||||||||||||||||||||||||||||||
| Continuation of Health Insurance Benefits | $ | — | $ | 21,000 | (6) | $ | 21,000 | (8) | $ | — | $ | — | |||||||||||||||||||||||||||||||||||
| Acceleration of Vesting of Stock Awards | $ | — | (5) | $ | 88,504 | (6) | $ | 517,610 | (8) | $ | — | $ | — | ||||||||||||||||||||||||||||||||||
| Total | $ | — | $ | 721,754 | $ | 1,150,860 | $ | — | $ | — | |||||||||||||||||||||||||||||||||||||
| John Semel | |||||||||||||||||||||||||||||||||||||||||||||||
| Cash Severance Payment | $ | — | $ | 500,000 | (6) | $ | 500,000 | (8) | $ | — | $ | — | |||||||||||||||||||||||||||||||||||
| Non-Equity Incentive Plan Compensation | $ | — | $ | 375,000 | (6) | $ | 375,000 | (8) | $ | — | $ | — | |||||||||||||||||||||||||||||||||||
| Continuation of Health Insurance Benefits | $ | — | $ | 21,000 | (6) | $ | 21,000 | (8) | $ | — | $ | — | |||||||||||||||||||||||||||||||||||
| Acceleration of Vesting of Stock Awards | $ | — | (5) | $ | 43,166 | (6) | $ | 287,604 | (8) | $ | — | $ | — | ||||||||||||||||||||||||||||||||||
| Total | $ | — | $ | 939,166 | $ | 1,183,604 | $ | — | $ | — | |||||||||||||||||||||||||||||||||||||
| Matthew Hillman | |||||||||||||||||||||||||||||||||||||||||||||||
| Cash Severance Payment | $ | — | $ | 350,000 | (6) | $ | 350,000 | (8) | $ | — | $ | — | |||||||||||||||||||||||||||||||||||
| Non-Equity Incentive Plan Compensation | $ | — | $ | 227,500 | (6) | $ | 227,500 | (8) | $ | — | $ | — | |||||||||||||||||||||||||||||||||||
| Continuation of Health Insurance Benefits | $ | — | $ | 21,000 | (6) | $ | 21,000 | (8) | $ | — | $ | — | |||||||||||||||||||||||||||||||||||
| Acceleration of Vesting of Stock Awards | $ | — | (5) | $ | 10,949 | (6) | $ | 85,437 | (8) | $ | — | $ | — | ||||||||||||||||||||||||||||||||||
| Total | $ | — | $ | 609,449 | $ | 683,937 | $ | — | $ | — | |||||||||||||||||||||||||||||||||||||
| Marc Brown | |||||||||||||||||||||||||||||||||||||||||||||||
| Cash Severance Payment | $ | — | $ | 325,000 | (12) | $ | — | $ | — | $ | — | ||||||||||||||||||||||||||||||||||||
| Continuation of Health Insurance Benefits | $ | — | $ | 51,243 | (12) | $ | — | $ | — | $ | — | ||||||||||||||||||||||||||||||||||||
| Total | $ | — | $ | 376,243 | $ | — | $ | — | $ | — | |||||||||||||||||||||||||||||||||||||
| Matt Mitchell | |||||||||||||||||||||||||||||||||||||||||||||||
| Cash Severance Payment | $ | — | $ | 144,000 | (6) | $ | 144,000 | (8) | $ | — | $ | — | |||||||||||||||||||||||||||||||||||
| Non-Equity Incentive Plan Compensation | $ | — | $ | 57,600 | (6) | $ | 57,600 | (8) | $ | — | $ | — | |||||||||||||||||||||||||||||||||||
| Continuation of Health Insurance Benefits | $ | — | $ | 21,000 | (6) | $ | 21,000 | (8) | $ | — | $ | — | |||||||||||||||||||||||||||||||||||
| Acceleration of Vesting of Stock Awards | $ | — | (5) | $ | 24,172 | (6) | $ | 148,951 | (8) | $ | — | $ | — | ||||||||||||||||||||||||||||||||||
| Total | $ | — | $ | 246,772 | $ | 371,551 | $ | — | $ | — | |||||||||||||||||||||||||||||||||||||
(1) “Change of Control” generally means any of the following events: (i) the acquisition by an individual, entity or group (other than us or any of our employee benefit plans) of beneficial ownership (within the meaning of Rule 13d-3 promulgated under the Exchange Act) of securities representing more than 50% of the voting securities of the company entitled to vote generally in the election of directors,
46
determined on a fully-diluted basis (unless a majority of the holders of company voting securities immediately prior to such acquisition retain directly or through ownership of one or more holding companies, immediately following such acquisition, a majority of the voting securities entitled to vote generally in the election of directors of the successor entity); (ii) the sale, transfer or other disposition of 50% or more of our assets to one or more unaffiliated individual(s), entities or groups; or (iii) when a majority of the members of the Board are not “company directors,” which term means: (a) individuals who, as of a specified date, were directors of the company; (b) individuals elected as directors of the company after such date for whose election proxies were solicited by the Board, or (c) individuals appointed to the Board after such date to fill vacancies caused by death or resignation (but not by removal) or to fill newly created directorships. A transaction does not constitute a Change of Control if its sole purpose is to change the state of the company’s incorporation or to create a holding company that will be owned in substantially the same proportions by the persons who held the company’s securities immediately before such transaction.
(2) For Mr. Spohn, “Cause” generally means the occurrence of one or more of the following: (i) conviction of, or a plea of guilty or nolo contendere to, a felony or other crime (except for misdemeanors which are not materially injurious to our business or reputation or the business or reputation of our affiliates); (ii) willful refusal to perform in any material respect such executive’s duties and responsibilities for us or our affiliates or failure to comply in any material respect with the terms of such executive’s agreements with us and our policies and procedures if such refusal or failure causes or reasonably expects to cause injury to us or our affiliates; (iii) fraud or other illegal conduct in such executive’s performance of duties for us or our affiliates; or (iv) any conduct by such executive which is materially injurious to us, our affiliates, our business reputation or the business reputation of our affiliates. For Mr. Royal, “Cause” has the same meaning except that subsection (ii) does not require that the willful refusal to perform cause or be reasonably expected to cause injury to us or our affiliates in order to find “Cause.” For Mr. Finkelstein, “Cause” generally meant the occurrence of one or more of the following: (i) conviction of, or a plea of guilty or nolo contendere to, a felony or other crime (except for misdemeanors which are not materially injurious to our business or reputation or the business or reputation of our affiliates); (ii) willful refusal to perform in any material respect such executive’s duties and responsibilities for us or our affiliates or failure to comply in any material respect with the terms of such executive’s agreements with us and our policies and procedures if such refusal or failure causes or reasonably expects to cause injury to us or our affiliates; (iii) fraud or other illegal conduct in such executive’s
24
25
Nonqualified Deferred Compensation
26
PROPOSAL 2
27
28
51
REPORT OF THE AUDIT COMMITTEE OF
29
52
PROPOSAL 3ADVISORY VOTE ON EXECUTIVE COMPENSATIONIn determining the compensation of our executive officers, the main goal of the Compensation Committee is to align the interests of our executive officers with the interests of our stockholders and the missions of our educational institutions. Accordingly, one of the primary objectives of the Compensation Committee in setting executive compensation is to incentivize and reward our executive officers for maintaining and enhancing the quality of our educational institutions. The Compensation Committee believes that emphasizing quality, particularly the quality of the academic process, is an appropriate indicator by which to measure and compare the performance of our executive officers when determining the amounts and types of compensation to be paid. The other primary objective of the Compensation Committee when setting executive compensation is to encourage our executive officers to increase the growth and profitability of our company, particularly as measured by revenue and EBITDA. “EBITDA” is a non-GAAP financial measure that is defined to mean net income plus interest expense, less interest income, plus income tax expense, and plus depreciation and amortization.The Compensation Committee believes in a “pay-for-performance” philosophy for the named executive officers, and that a substantial portion of the overall compensation package for each executive officer should be variable and tied to the achievement of the objectives described above. The Compensation Committee also seeks to pay our executive officers at levels that are generally consistent with those paid at other similarly sized companies in our industry in order to maintain an adequate level of retention while also providing sufficient incentives to achieve our objectives.The Compensation Committee and the Board believe that our compensation design and practices are effective in implementing our executive compensation philosophy and objectives.We are required to submit a proposal to stockholders for an advisory vote to approve the compensation of our named executive officers pursuant to Section 14A of the Exchange Act. This vote, commonly known as a “say-on-pay” vote, gives our stockholders the opportunity to express their views on the compensation of our named executive officers. This vote is not intended to address any specific item of compensation, but rather the overall compensation of our named executive officers and the compensation principles, policies and practices described in this proxy statement.Accordingly, the following resolution will be submitted for a stockholder vote at the Annual Meeting.“RESOLVED, that the compensation of our named executive officers, as disclosed in the proxy statement for our 2020 Annual Meeting of Stockholders pursuant to Item 402 of Regulation S-K, compensation tables and narrative discussion, is hereby APPROVED.”As this is an advisory vote, the result will not be binding on us, the Board or the Compensation Committee. However, the Compensation Committee values the views expressed by our stockholders in their vote on this proposal and will consider the outcome of the vote when evaluating our compensation principles, policies and practices. Proxies submitted without direction pursuant to this solicitation will be voted “FOR” the approval of the compensation of our named executive officers as presented in this proxy statement.Our most recent stockholder advisory vote on executive compensation was held at our 2017 Annual Meeting of Stockholders based upon the Board’s determination, taking into account the advisory vote of our stockholders on the frequency of stockholder advisory votes on executive compensation held at our 2011 Annual Meeting of Stockholders, that the stockholder advisory vote on executive compensation should be held every three years. The next annual meeting of stockholders at which a stockholder advisory vote on executive compensation will be held will be the 2023 Annual Meeting of Stockholders, taking into account the advisory vote of our stockholders on the frequency of stockholder advisory votes on executive compensation held at our 2017 Annual Meeting of Stockholders, that the stockholder advisory vote on executive compensation should be held every three years.THE BOARD UNANIMOUSLY RECOMMENDS A VOTE “FOR” THE APPROVAL ON AN ADVISORY, NON-BINDING BASIS OF THE COMPENSATION OF OUR NAMED EXECUTIVE OFFICERS AS PRESENTED IN THIS PROXY STATEMENT
30
31
53
32
54
May 20, 202233
55
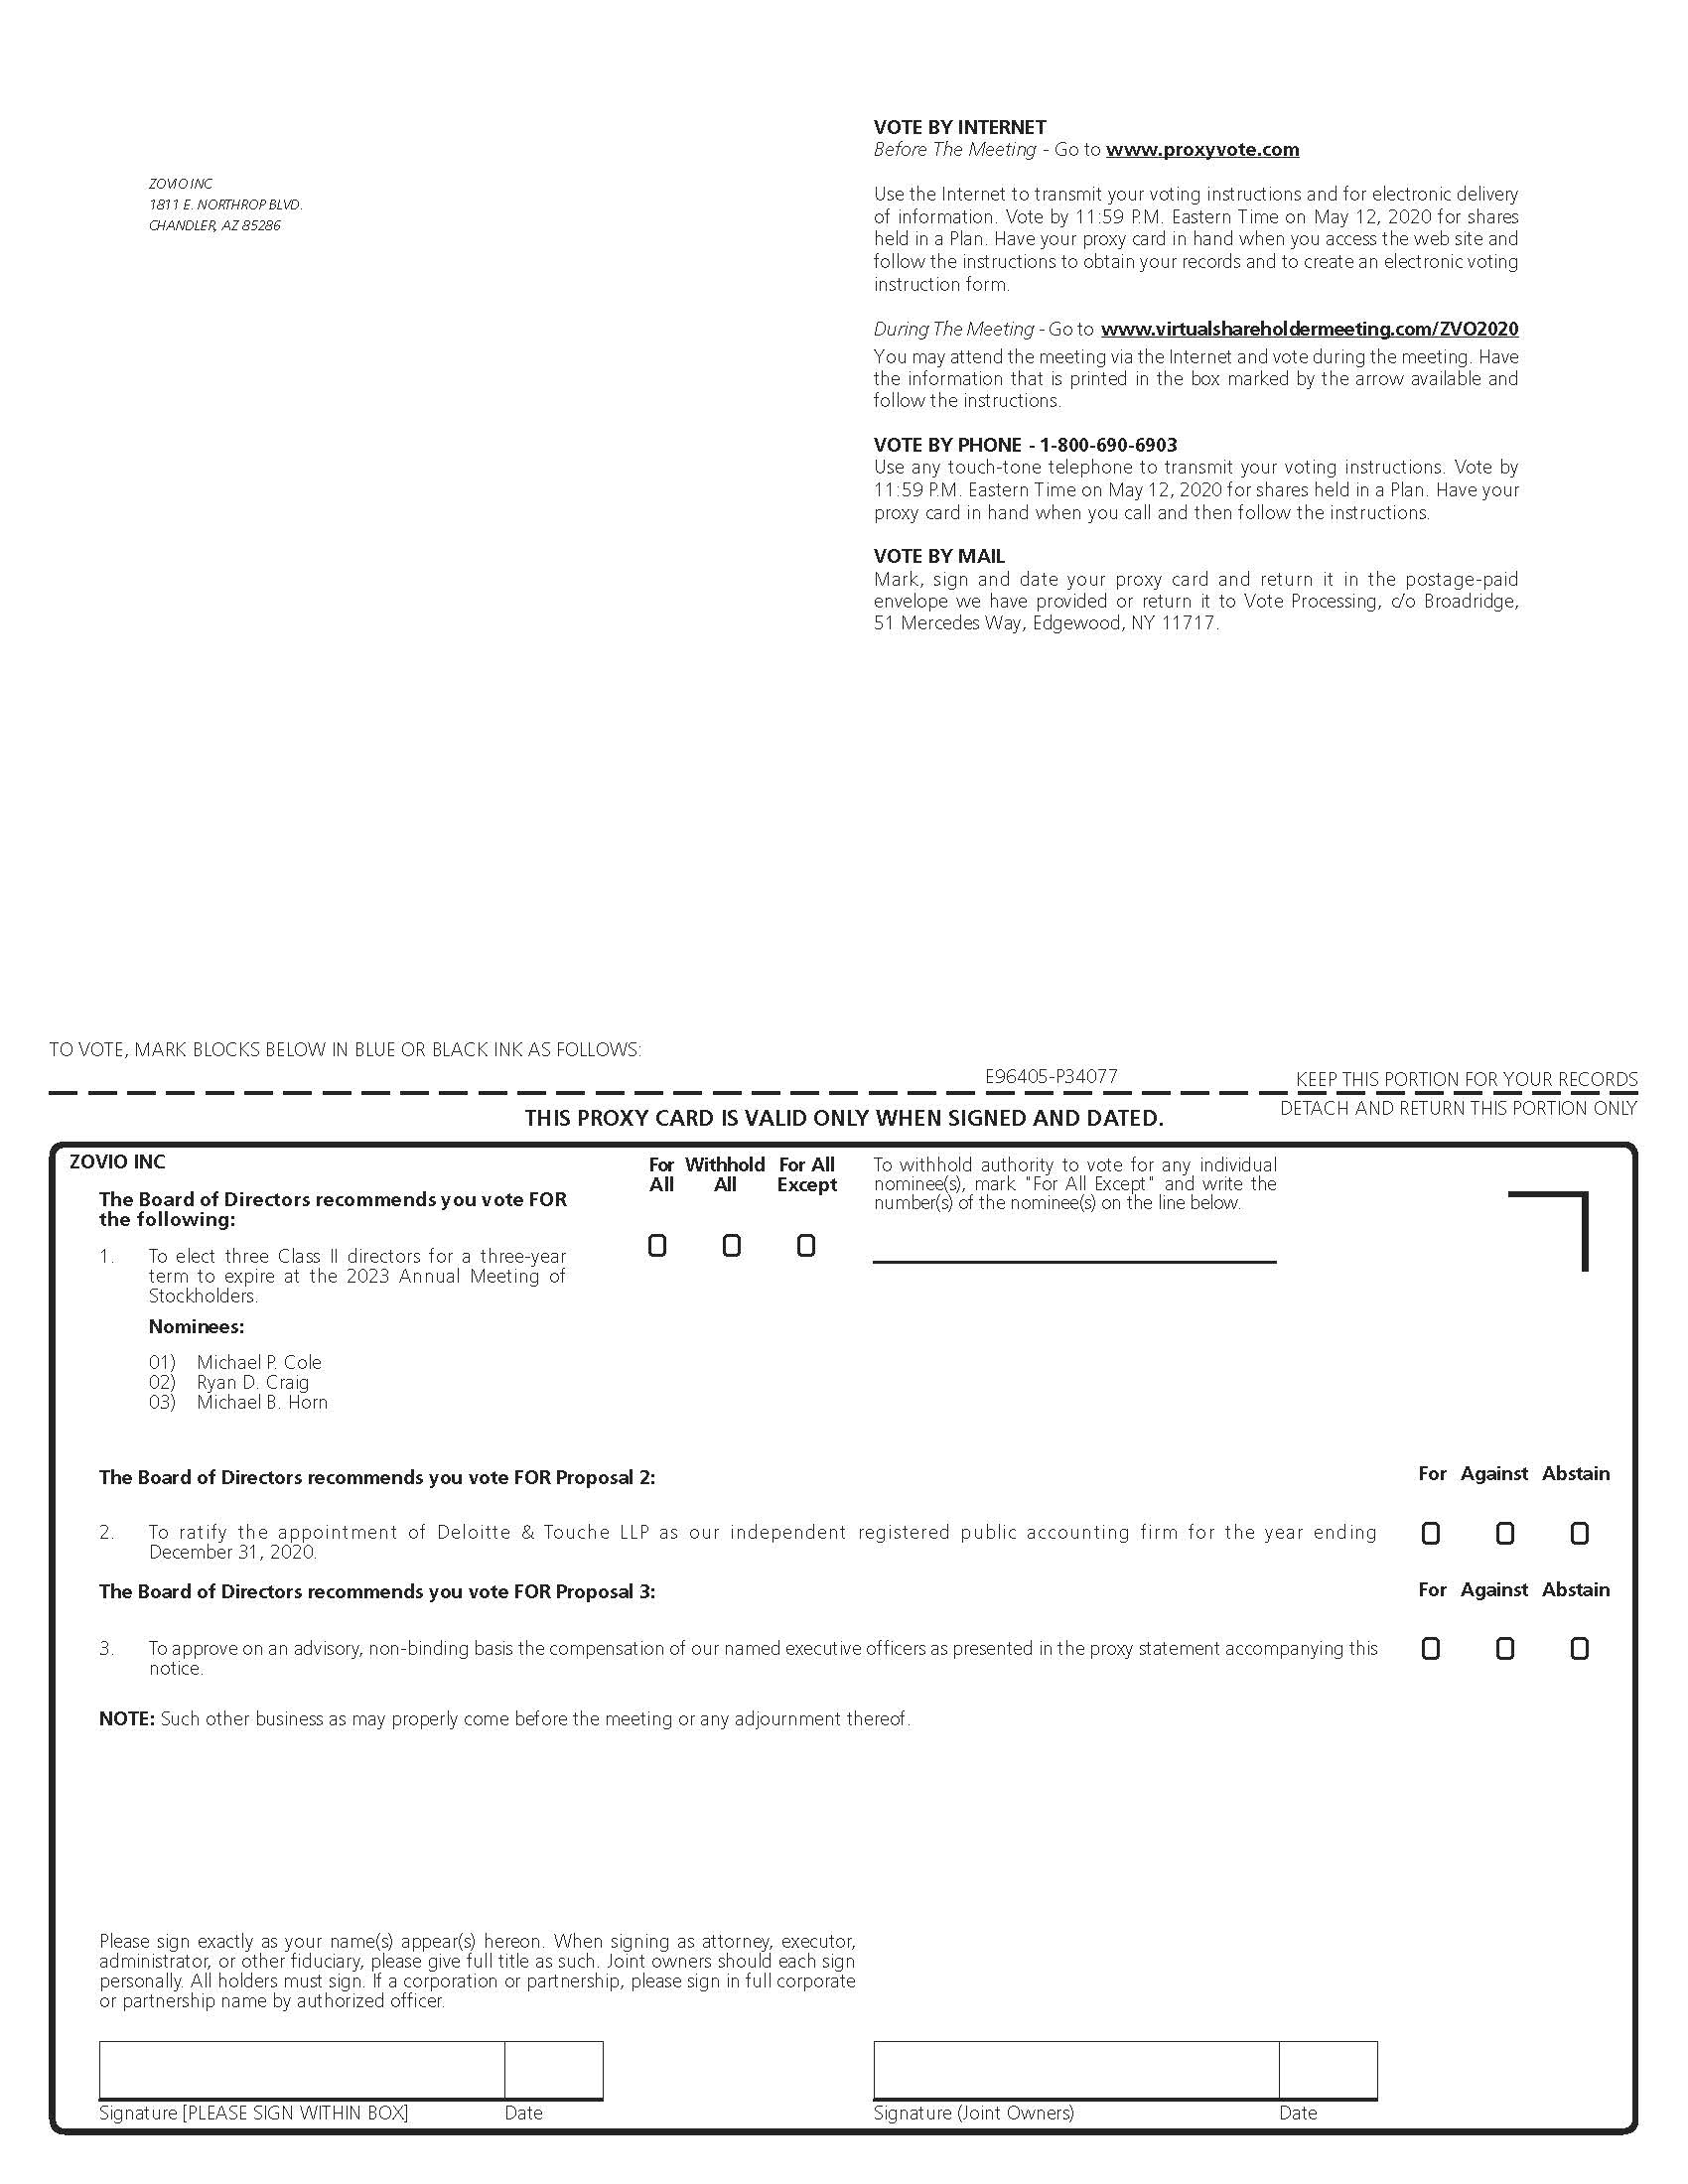
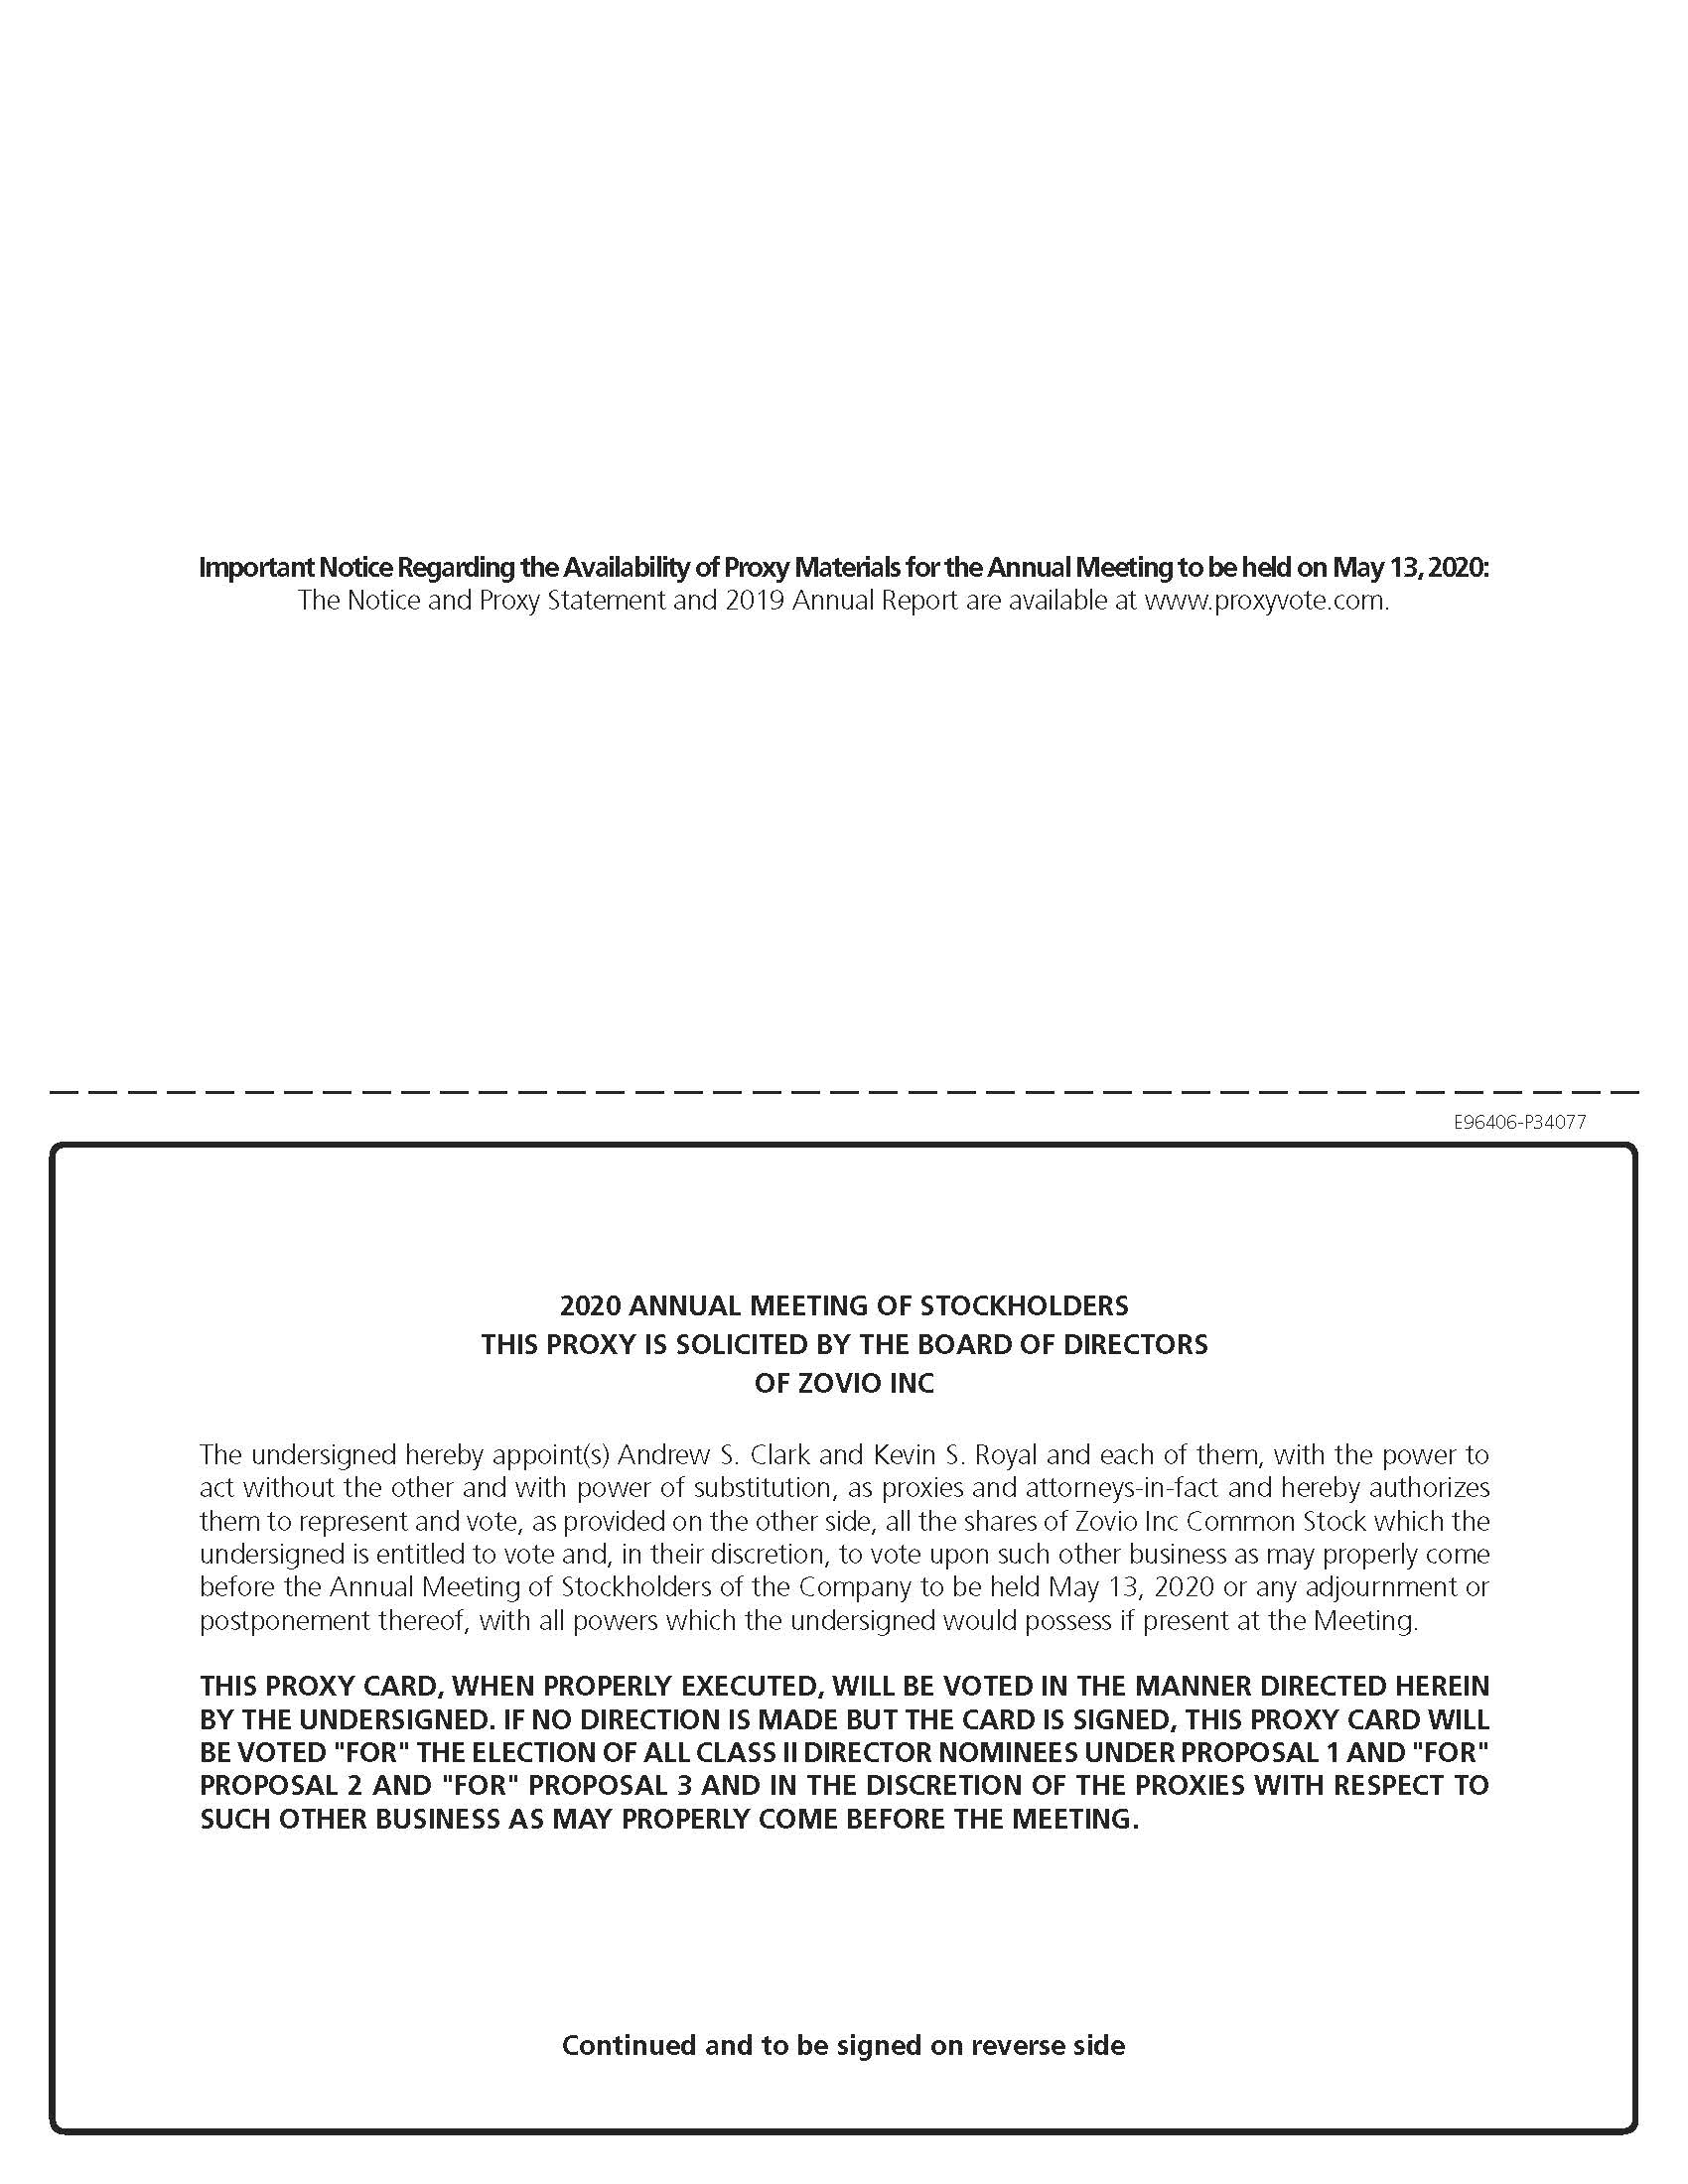
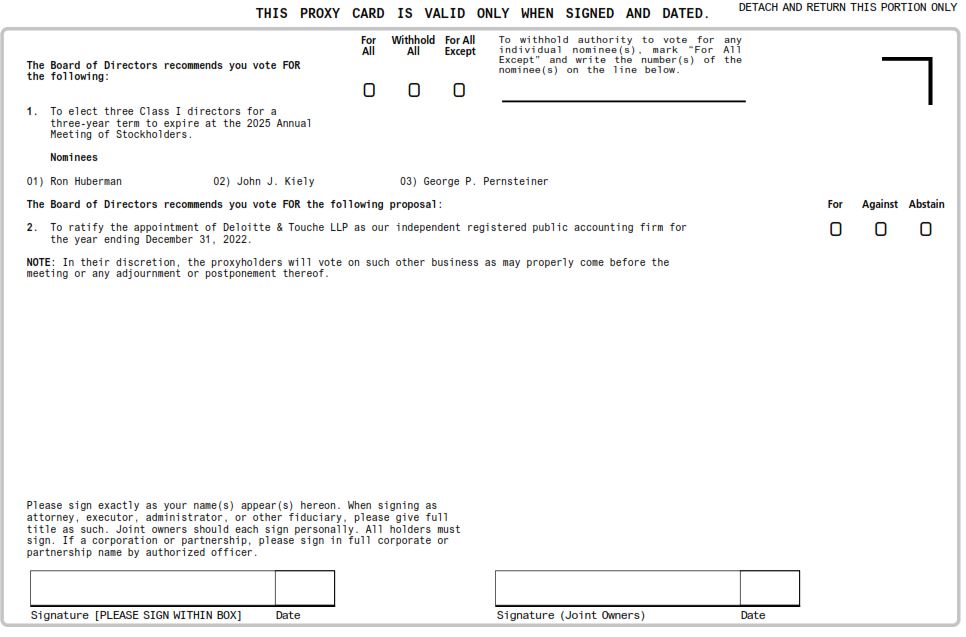

performance of duties for us or our affiliates; or (iv) any conduct by such executive which is materially injurious to us, our affiliates, our business reputation or the business reputation of our affiliates. For Mr. Royal, “Cause” has the same meaning except that subsection (ii) does not require that the willful refusal to perform cause or be reasonably expected to cause injury to us or our affiliates in order to find “Cause.”
(3) For Mr. Spohn, “Good Reason” generally means any of the following events: (a) a material diminution in his annual base salary; (b) a material diminution in his authorities, duties, responsibilities or reporting structure; or (c) our material breach of his employment agreement. For Mr. Royal, “Good Reason” generally means any of the following events: (a) a material diminution in their annual base salary; (b) a material diminution in his authorities, duties, responsibilities or reporting structure; (c) notification of a material change in his geographic work location; or (d) our material breach of his Severance Agreement. (4) For Mr. Spohn, “Disability” generally means he is unable to engage in any substantial gainful activity by reason of any medically determinable physical or mental impairment which can be expected to result in death or which has lasted or can be expected to last for a continuous period of not less than 12 months. (5) The Compensation Committee has discretion as to whether to approve the acceleration of the RSUs and PSUs that would accelerate based on a Change of Control. (6) If the NEO’s employment is terminated by us without Cause or by employee for Good Reason (and other than for death or Disability), then the NEO will receive, pursuant to the Amended and Restated Executive Severance Plan and the Severance Agreement executed by the NEO thereunder, (i) cash payments equal in the aggregate to one times his annual base salary, payable in equal bi-weekly installments over the 12-month period following termination date; (ii) medical, dental and life insurance premiums for up to 12 months following termination, provided that such benefit will terminate immediately if he is offered comparable coverage in connection with new employment, paid by the company at the same cost as if the NEO continued as an active employee of the company; and (iii) a lump sum cash payment equal to the pro-rata portion of his annual cash bonus for the fiscal year of termination based on the percentage of time he was employed in such fiscal year, payable at the same time the company pays annual cash bonuses to other members of senior management. (7) If Mr. Spohn’s employment is terminated by us without Cause or by Mr. Spohn for Good Reason (and other than for death or Disability), then Mr. Spohn will receive, pursuant to his employment agreement, (i) continued payment of base salary for a period of 18 months; (ii) if his termination occurs following the end of our fiscal year but before the date annual bonuses are paid for that year, payment of his |
annual bonus for the completedprior fiscal year priorbased on actual achievement of the relevant performance objectives; and (iii) reimbursement by the Company for up to 18 months of that portion of the yearpremiums the Company previously paid for health insurance coverage for him and his eligible dependents of termination, if not already paid.his COBRA premiums to continue such health insurance coverage, or a taxable lump sum payment for the equivalent period in the event payment of such subsidy for COBRA premiums would violate applicable law. Mr. Finkelstein’sSpohn’s receipt of such severance benefits is conditioned upon him providing us with a release of claims against us, our affiliates and related parties, and his compliance with certain non-disparagement, non-solicitation and confidentiality requirements set forth in his employment agreement.
(8) If the NEO’s employment is terminated by us without Cause or by the NEO for Good Reason within 24 months after a Change of Control (and other than for death or Disability), then pursuant to the Amended and Restated Executive Severance Plan and the Severance Agreement executed by the NEO thereunder, in addition to the severance benefits described above, the NEO will receive full vesting acceleration of all outstanding time-based equity awards as of their termination date.
(9) If Mr. Spohn’s employment is terminated by us without Cause or by Mr. Spohn for Good Reason within 24 months after a Change of Control (and other than for death or Disability), then pursuant to his employment agreement Mr. Spohn will receive the severance benefits described above, except that he will receive full vesting acceleration of all outstanding time-based equity awards as of his termination date.
(10) If Mr. Spohn’s employment is terminated due to his death or Disability, then pursuant to his employment agreement (i) his outstanding time-based equity awards will vest as if his termination date had occurred one year later; (ii) he or his dependents, as applicable, will be
47
entitled to receive his Accrued Pay (as defined in his employment agreement); (iii) he or his estate, as applicable, will receive six monthly installments of his base salary; and (iv) he or his dependents, as applicable, will receive company-paid medical benefits for a period of six months following the date of his termination. No amount is included for Mr. Finkelstein’sSpohn’s PSUs because they remain subject to performance requirements even after the triggering event occurs.
(11) Mr. Clark’s employment was terminated by us without Cause effective March 31, 2021, and he provided us with a release of claims against the company. Mr. Clark therefore received, pursuant to his employment agreement, (i) cash payments equal in the aggregate to two times the sum of his annual base salary and annual target bonus, payable in equal bi-weekly installments over the 24-month period following his termination date; (ii) reimbursement of premium payments for continuation coverage under a company-sponsored group medical plan for up to 24 months following termination, provided that such benefit will terminate immediately if he was offered comparable coverage in connection with his employment by another employer; and (iii) accelerated vesting of outstanding time-based equity awards as if his service had terminated one year later. No PSUs are included, as they terminated upon Mr. Clark's termination date. There was no non-equity incentive compensation paid out for 2021.
(12) Mr. Brown’s employment was terminated by us without Cause effective June 25, 2021, and he provided us with a release of claims against the company. Mr. Brown therefore received, pursuant to the Amended and Restated Executive Severance Plan and the Severance Agreement, (i) cash payments equal in the aggregate to one year of his annual base salary, payable in equal bi-weekly installments over the 12-month period following his termination date; and (ii) continuation coverage under a company-sponsored group medical plan for up to 12 months following termination. There was no non-equity incentive compensation paid out for 2021.
The following table shows certain information for 20192021 for the NEOs under the Zovio Nonqualified Deferred Compensation Plan (the “Deferred Compensation Plan”). The Deferred Compensation Plan was eliminated effective December 31, 2021, and any related distributions will occur for participants in January 2023.
| Non-Qualified Deferred Compensation (1) | ||||||||||||||||||||||||||||||||
| Name | Executive Contributions in Last FY ($) | Registrant Contributions in Last FY ($) | Aggregate Earnings in Last FY ($) | Aggregate Withdrawals/Distributions ($) | Aggregate Balance at Last FYE ($) | |||||||||||||||||||||||||||
| Diane Thompson | 32,947 | — | 90,872 | — | 691,227 | |||||||||||||||||||||||||||
| Marc Brown | 14,700 | — | 44,591 | 430,670 | — | |||||||||||||||||||||||||||
(1) There are no non-qualified deferred compensation earnings reflected in the Summary Compensation Table above because no NEO received above-market or preferential earnings on such compensation.
| CEO PAY RATIO | |||||||||||||||
The Compensation Committee monitors the relationship between the pay our executive officers receive and the pay that all other employees receive. The Compensation Committee believes executive pay must be equitable to motivate our employees and to create stockholder value. The Compensation Committee reviewed a comparison of CEO pay, to the pay of all other employees as of December 31, 2021.
Our CEO to median employee pay ratio is calculated in compliance with Item 402(u) of Regulation S-K, as promulgated under the Dodd-Frank Wall Street Reform and Consumer Protection Act. Using this methodology, our CEO's compensation in 2021 was approximately 40 times the pay of our median employee.
As allowed by Item 402(u) of Regulation S-K, for fiscal year 2021, we used the fiscal year 2020 calculations and did not recalculate the median employee. As a result, our median employee for fiscal year 2021 did not change from fiscal year 2020. Outlined below is the process we applied for identifying the median employee for fiscal year 2020:
•We identified the median employee using our workforce population (excluding our former CEO) as of December 31, 2020, which included 1,522 full-time, temporary or seasonal employed on that date;
•We consistently applied the 2020 W-2 earnings as a compensation measure for the median employee;
•We did not make any assumptions, adjustments, or estimates with respect to total cash compensation;
•We annualized the compensation for any full-time employees that were not employed by us for all of 2021 or who were on leave of absence during 2021;
•We did not annualize pay for those employees who worked less than full-time;
48
•We believe the use of total W-2 compensation for all employees is the most accurate and consistently applied compensation measure.
After identifying the median employee based on total W-2 compensation, we calculated annual total compensation for such employee for 2021 using the same methodology we use for our named executive officers as set forth in the 2021 Summary Compensation Table earlier in this proxy statement. This calculation is illustrated in the table below:
| CEO | Median Employee | |||||||||||||||||||
| Total | $ | 2,850,929 | $ | 70,489 | ||||||||||||||||
49
| PROPOSAL 2 | ||
RATIFICATION OF APPOINTMENT OF INDEPENDENT REGISTERED PUBLIC ACCOUNTING FIRM
We are asking you to ratify the appointment of Deloitte & Touche LLP (“Deloitte”), as our independent registered public accounting firm for the year ending December 31, 2020.2022. Representatives of Deloitte are expected to be present at the Annual Meeting, will have an opportunity to make a statement should they desire to do so and will be available to respond to appropriate questions.
Although our bylaws do not require that our stockholders approve the appointment of our independent registered public accounting firm, the Board is submitting the selection of Deloitte to our stockholders for ratification as a matter of good corporate practice. If our stockholders vote against the ratification of Deloitte, the Audit Committee will reconsider whether to continue to retain the firm. Even if our stockholders ratify the appointment of Deloitte, the Audit Committee may choose to appoint a different independent registered public accounting firm at any time during the year if the Audit Committee determines that such a change would be in the best interests of our company and our stockholders.
Independent Registered Public Accounting Firm Fees and Services
The following table presents fees for professional audit and other services rendered by Deloitte for the years ended December 31, 2021 and 2020.
| 2021 | 2020 | ||||||||||
| Audit Fees (1) | $ | 1,315,818 | $ | 2,257,624 | |||||||
| Audit‑Related Fees (2) | — | 265,745 | |||||||||
| Tax Fees (3) | 19,626 | 157,236 | |||||||||
| All Other Fees (4) | 3,790 | 3,790 | |||||||||
| Total | $ | 1,339,234 | $ | 2,684,395 | |||||||
(1) Audit Fees consist of the aggregate fees billed for 2021 and 2020 for professional services rendered for the audit of our annual consolidated financial statements asand the review of consolidated financial statements included in our quarterly reports, or professional services rendered in connection with our filing of various registration statements or otherwise normally provided in connection with statutory and forregulatory filings or engagements.
(2) Audit-Related Fees consist of the years ended December 31, 2019 and 2018, respectively, andaggregate fees billed in 2021 and 2020 for otherassurance and related services that are reasonably related to the performance of the audit or review of our consolidated financial statements and are not reported under Audit Fees. Such fees primarily related to auditing unusual transactions and compliance advice regarding Section 404 of the Sarbanes-Oxley Act of 2002.
(3) Tax Fees consist of the aggregate fees billed in 2021 and 2020 for professional services rendered by Deloitte during those respective periods.for tax compliance, responses to tax audits, tax advice and tax planning. Such fees primarily related to federal and state tax compliance, planning and consulting.
(4) All Other Fees consist of the aggregate fees billed in 2021 and 2020 for products and services other than the services reported under Audit Fees, Audit-Related Fees or Tax Fees. Such fees related to a subscription for accounting software.
| 2019 | 2018 | ||||||
| Audit Fees (1) | $ | 2,602,535 | $ | 2,821,536 | |||
| Audit‑Related Fees (2) | — | 80,200 | |||||
| Tax Fees (3) | 401,335 | 380,524 | |||||
| All Other Fees (4) | 3,790 | 3,790 | |||||
| Total | $ | 3,007,660 | $ | 3,286,050 | |||
Audit Committee Pre-Approval Policy
Our Audit Committee has adopted a Pre-Approval Policy pursuant to which the Audit Committee must pre-approve the audit and non-audit services performed by our independent registered public accounting firm to assure that the provision of such services does not impair the firm’s independence. Before we may engage the independent registered public accounting firm to render a service, the engagement must be either specifically approved by the Audit Committee or entered into pursuant to the Pre-Approval Policy. The Audit Committee may consider the amount or range of estimated fees as a factor in determining whether a proposed service would impair the independence of our independent registered public accounting firm. Under the Pre-Approval Policy, the Audit Committee may delegate pre-approval authority to one or more of its members, and has delegated pre-approval authority to Mr. CrandallKiely as Chair of the Audit Committee. At the Annual Meeting, Mr. Crandall will retire from our Board and is not standing for re-election. Mr. Kiely is expected to be appointed as Chair of the Audit Committee and, if so appointed, will have such pre-approval authority following the Annual Meeting. The member or members to whom such authority is delegated are required to report any pre-approval decisions to the Audit Committee at its next scheduled meeting. The Audit Committee may not delegate to management the Audit Committee’s responsibilities to pre-approve services to be performed by our independent registered public accounting firm.
All services provided by Deloitte during fiscal years 20192021 and 20182020 were pre-approved by the Audit Committee.
50
Vote Required
Ratification of the appointment of Deloitte & Touche LLP, as our independent registered public accounting firm for the year ending December 31, 2020,2022, requires the affirmative vote of a majority of the shares present in person or by proxy and entitled to vote at a meeting at which a quorum is present. Abstentions are deemed to be votes cast and have the same effect as a vote “AGAINST” the proposal. This proposal is considered a routine or “discretionary” matter on which your broker, bank or other agent will be able to vote on your behalf even if it does not receive instructions from you; therefore, no broker non-votes are expected to exist in connection with this proposal.
THE BOARD RECOMMENDS A VOTE “FOR” RATIFICATION OF THE APPOINTMENT
OF DELOITTE & TOUCHE LLP AS OUR
INDEPENDENT REGISTERED PUBLIC ACCOUNTING FIRM
51
| REPORT OF THE AUDIT COMMITTEE TO THE BOARD OF DIRECTORS | ||
The following Audit Committee Report shall not be deemed to be “soliciting material” or to otherwise be considered “filed” with the SEC, nor shall such information be deemed incorporated by reference into any filing of ours under the Securities Act of 1933, as amended, or the Securities Exchange Act of 1934, as amended, except to the extent we specifically incorporate it by reference into such filing.
The Audit Committee oversees our financial reporting process on behalf of the Board of Directors. Management is responsible for the preparation, presentation and integrity of the financial statements, including establishing accounting and financial reporting principles and designing systems of internal control over financial reporting. Our independent registered public accounting firm is responsible for expressing an opinion as to the conformity of our consolidated financial statements with generally accepted accounting principles. The Audit Committee operates pursuant to a charter that is available on our website at http://www.zovio.com under “Investors - Governance.”
In performing its responsibilities, the Audit Committee has reviewed and discussed with management and Deloitte & Touche LLP (“Deloitte & Touche”), our independent registered public accounting firm, the audited consolidated financial statements in our Annual Report on Form 10-K for the year ended December 31, 2019.2021. The Audit Committee has also discussed with Deloitte & Touche the matters required to be discussed by the applicable requirements of Auditing Standard No. 1301, Communications with Audit Committees, as adopted by the Public Company Accounting Oversight Board.
The Audit Committee has received written disclosures and the letter from Deloitte & Touche required by the applicable requirements of the Public Company Accounting Oversight Board regarding Deloitte & Touche’s communications with the Audit Committee concerning independence, and has discussed with Deloitte & Touche its independence.
Based upon the review and discussions referred to above, the Audit Committee recommended to the Board of Directors that our audited consolidated financial statements be included in our Annual Report on Form 10-K for the year ended December 31, 2019.
2021.
| Dated: | Audit Committee: | ||||
Teresa S. Carroll Ryan D. Craig Victor K. Nichols | |||||
52
CERTAIN RELATIONSHIPS AND RELATED TRANSACTIONS
The Charter of the Audit Committee provides that any related party transaction (or series of transactions) that may require disclosure under the rules of the SEC must be reviewed and approved by the Audit Committee. When evaluating such transactions, the Audit Committee focuses on whether the terms of such transactions are at least as favorable to us as terms we would receive on an arm’s-length basis from an unaffiliated third party.
There have been no related party transactions since the beginning of our last fiscal year, including any currently proposed transactions, to which we have been or will be a party, in which the amount involved exceeds $120,000 and in which any of our directors, executive officers, holders of more than five percent of our common stock or any member of the immediate family of any of the foregoing persons has had or will have a direct or indirect material interest. This description does not cover (i) compensation arrangements with our executive officers and directors that are described elsewhere in this proxy statement under the sections entitled “Executive Compensation” and “Corporate Governance — Director Compensation” or (ii) compensation arrangements with our executive officers other than our NEOs that have been approved, or recommended to the Board for approval, by our Compensation Committee.
Indemnification Agreements
Our certificate of incorporation and bylaws require us to indemnify our directors and executive officers to the fullest extent permitted by Delaware law. Additionally, as permitted by Delaware law, we have entered into indemnification agreements with each of our directors and executive officers pursuant to which we agree to indemnify those individuals to the fullest extent permitted by Delaware law against all expenses, judgments, fines, settlements and other amounts actually and reasonably incurred by such individual in connection with the investigation, defense, settlement or appeal of any pending, threatened or completed action, hearing, suit or other proceeding to which they are or may be made a party or threatened to be made a party by reason of their position as a director, officer or other agent of ours, and otherwise to the fullest extent permitted under Delaware law and our certificate of incorporateincorporation and bylaws. We also have an insurance policy covering our directors and executive officers with respect to certain liabilities, including liabilities arising under the Securities Act of 1933, as amended, (the “Securities Act”) or otherwise.
53
| EQUITY COMPENSATION PLAN INFORMATION | ||
The following table summarizes the number of outstanding options and rights granted to our employees, consultants and directors, as well as the number of shares of common stock remaining available for future issuance, under our equity compensation plans as of December 31, 2019:2021:
| Plan Category | Number of securities to be issued upon exercise of outstanding options and rights (a) | Weighted-average exercise price of outstanding options and rights (b) | Number of securities remaining available for future issuance under equity compensation plans (excluding securities reflected in column (a)) (c) | |||||||||||||||||||||||
| Equity compensation plans approved by security holders (1) (2) (3) | 4,379,123 | (4) | $ | 7.67 | (5) | 6,921,689 | ||||||||||||||||||||
| Equity compensation plans not approved by security holders | 1,724,138 | — | — | |||||||||||||||||||||||
| Total | 6,103,261 | $ | 7.67 | 6,921,689 | ||||||||||||||||||||||
(1)Consists of the 2009 Plan and our Employee Stock Purchase Plan.
(2)The 2009 Plan provides for an annual increase in the number of shares available for issuance thereunder on each subsequent January 1 through and including January 1, 2027, in an amount equal to the least of (i) two percent (2%) of the outstanding shares of our common stock on the last day of the immediately preceding fiscal year, (ii) 1,300,000 shares of our common stock or (iii) such lesser amount as the Board may determine.
(3)The Employee Stock Purchase Plan provides for an annual increase in the number of shares available for issuance thereunder on each subsequent January 1 through and including January 1, 2027, in an amount equal to the least of (a) one percent (1%) of the outstanding shares of our common stock on the last day of the immediately preceding fiscal year, (b) 400,000 shares of our common stock or (c) such lesser amount as the Board or Compensation Committee may determine.
(4)Includes 4,879,868 shares of common stock issuable upon the vesting of outstanding RSUs, PSUs and MSUs.
(5)Calculated taking into account the 4,879,868 shares of common stock issuable upon the vesting of outstanding RSUs, PSUs and MSUs without the payment of any exercise price.
| Plan Category | Number of securities to be issued upon exercise of outstanding options and rights (a) | Weighted-average exercise price of outstanding options and rights (b) | Number of securities remaining available for future issuance under equity compensation plans (excluding securities reflected in column (a)) (c) | |||||||||
| Equity compensation plans approved by security holders (1) (2) | 5,381,373 | (3) | $ | 8.88 | (4) | 6,452,654 | ||||||
| Equity compensation plans not approved by security holders | — | — | — | |||||||||
| Total | 5,381,373 | $ | 8.88 | 6,452,654 | ||||||||
54
OTHER MATTERS
We know of no other matters to be submitted at the Annual Meeting. If any other matters are properly brought before the Annual Meeting, it is the intention of the individuals we have designated as proxies to vote the shares that they represent on such matters in accordance with their judgment.
For further information about Zovio Inc, please refer to our Annual Report on Form 10-K for the year ended December 31, 20192021 filed with the SEC on February 20, 2020.April 15, 2022. Our Annual Report on Form 10-K is publicly available on our website at www.zovio.com under “Investors.” You may also obtain a copy by sending a written request to Zovio Inc, Attn: Investor Relations, 1811 E. Northrop Blvd, Chandler, AZ 85286.
| By order of the Board of Directors, | |||||
| /s/ | |||||
Dated: April 2, 2020
May 20, 2022
55